 Infinity Ground (AIN)
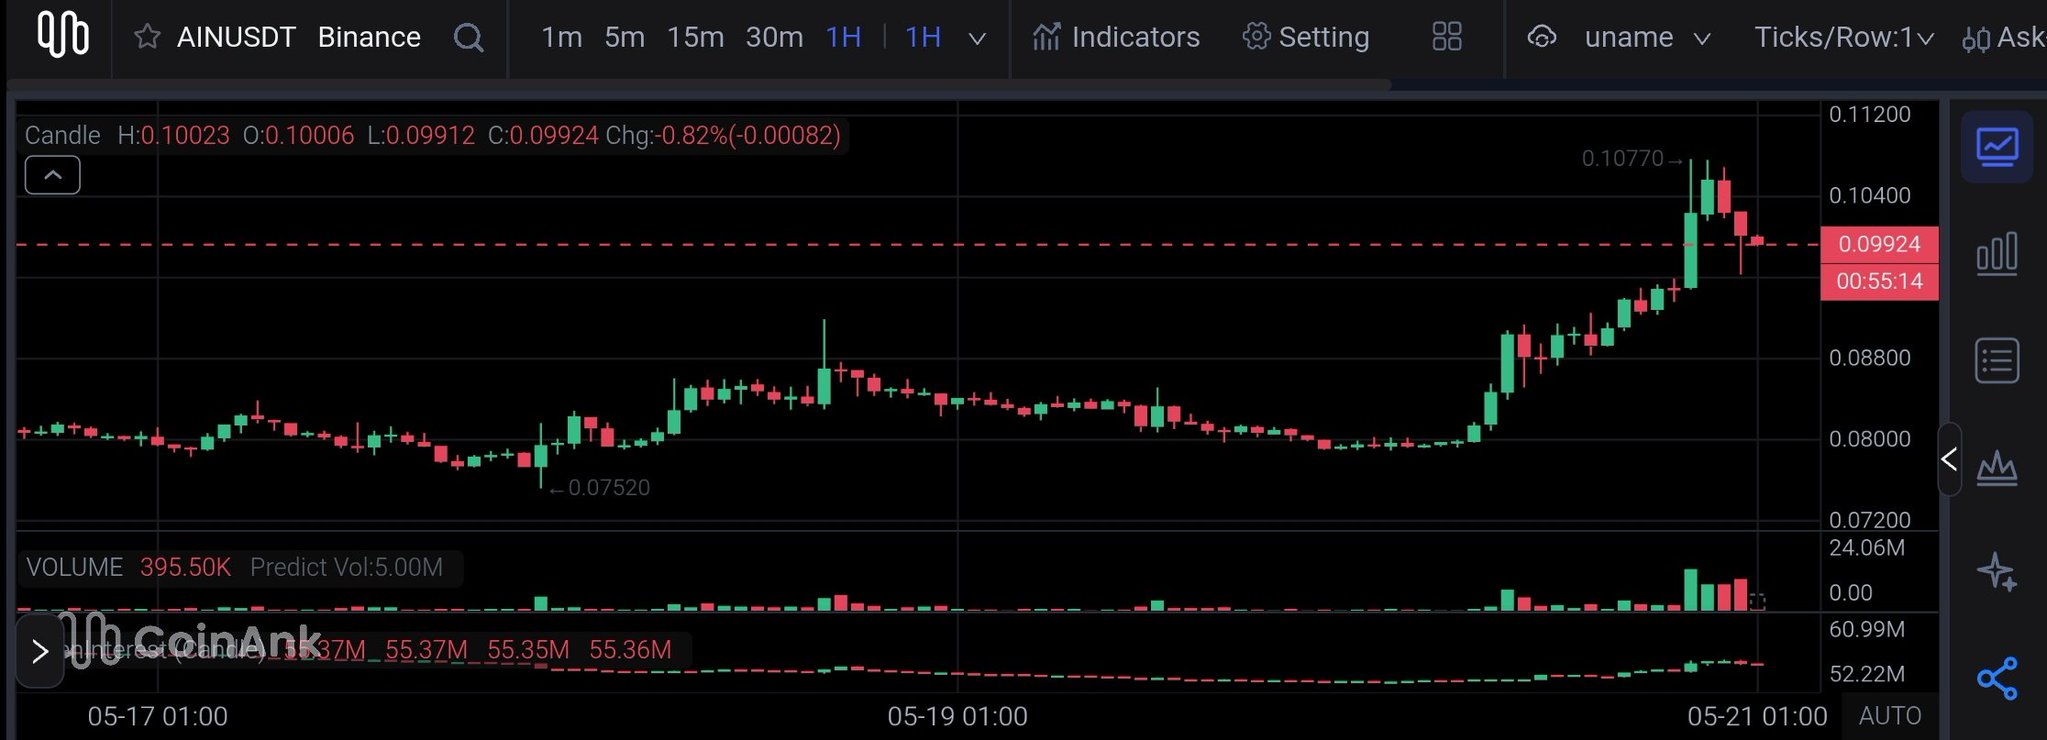
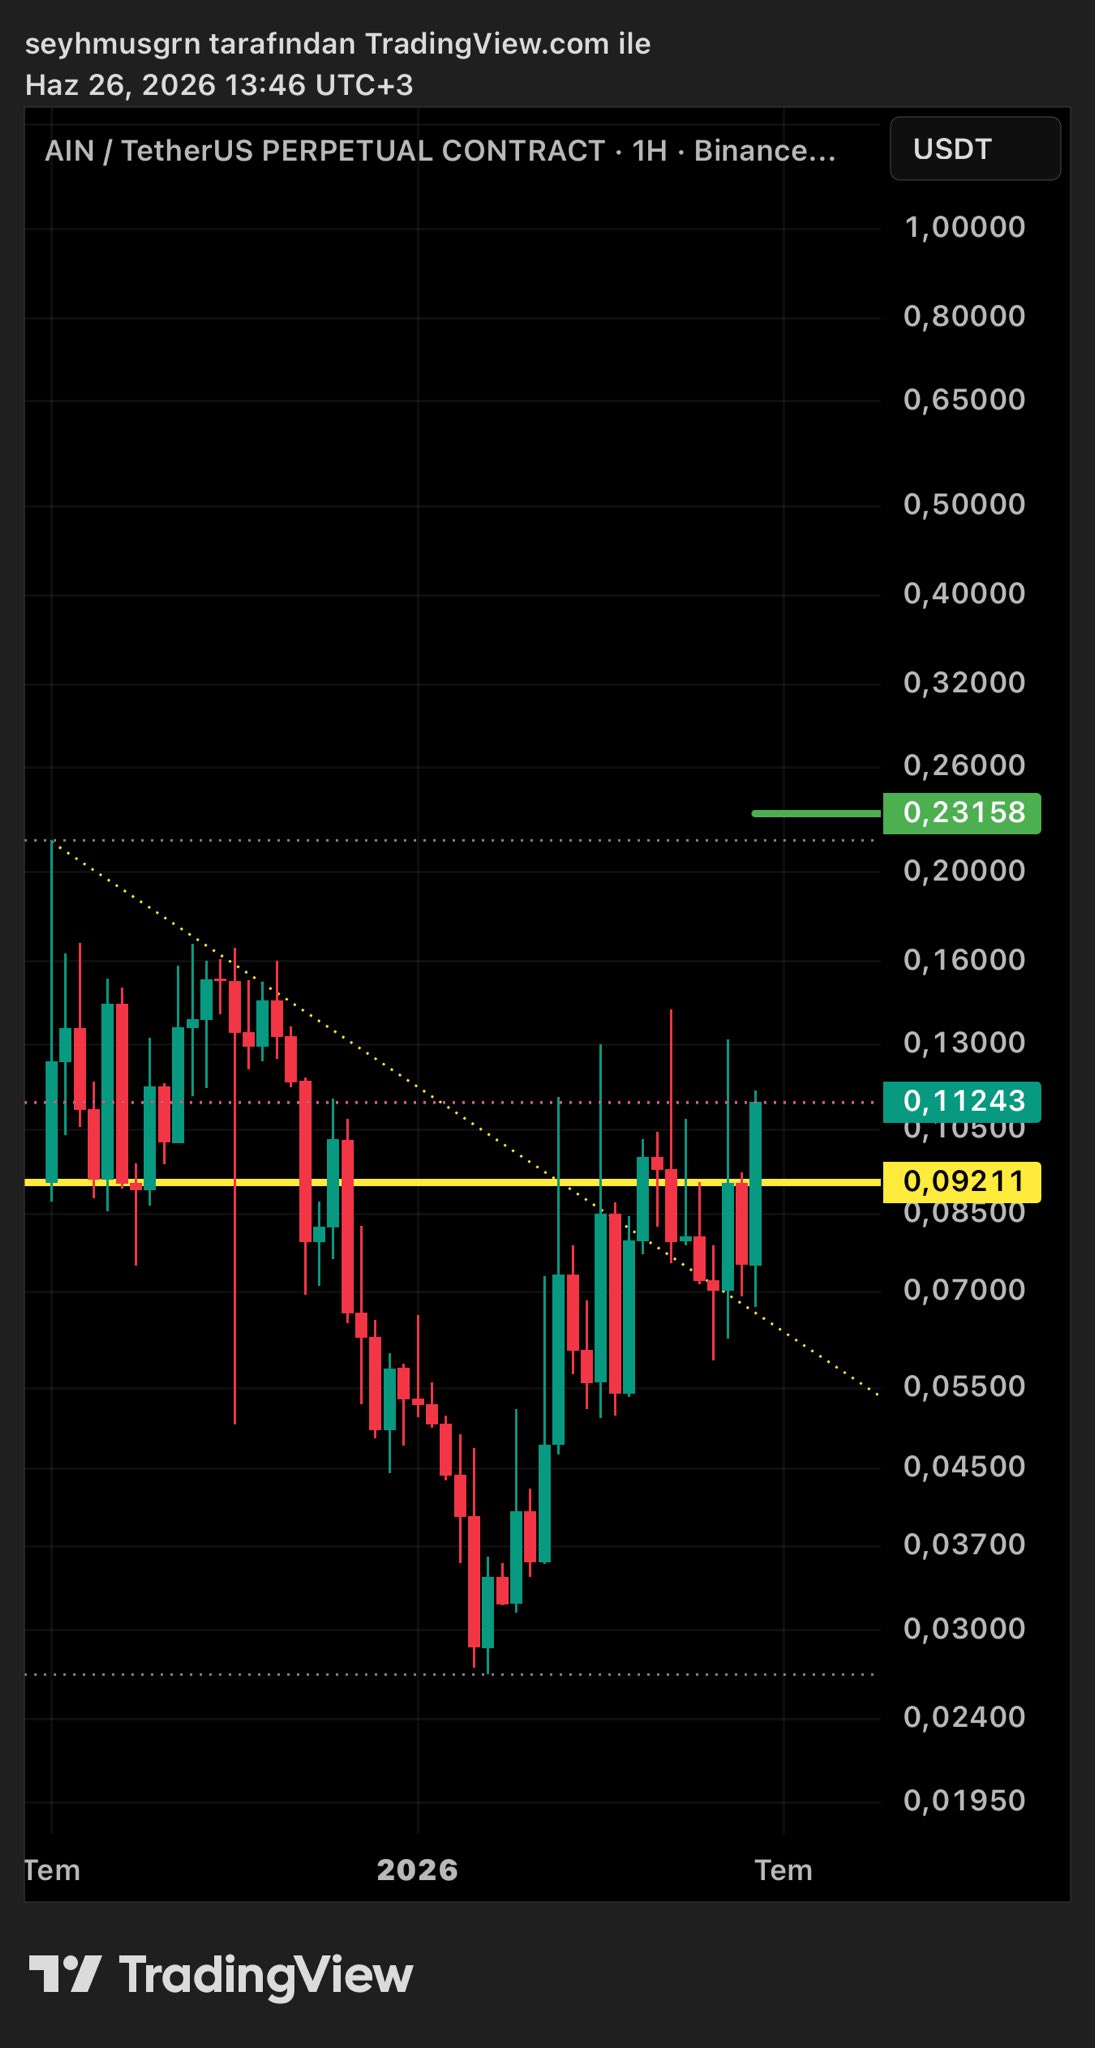
$0.08416 -4.90% 24H
- 71社交熱度指數(SSI)- (24h)
- #21市場預警排名(MPR)0
- 124小時社交提及量- (24h)
- 100%24小時KOL看好比例1位活躍KOL
- 概要
- 看漲訊號
- 看跌訊號
社交熱度指數(SSI)
- 總體資料71SSI
- 社交熱度趨勢(7D)價格(7D)情緒分佈看漲 (100%)社交熱度洞察
市場預警排名(MPR)
- 預警解讀
相關推文
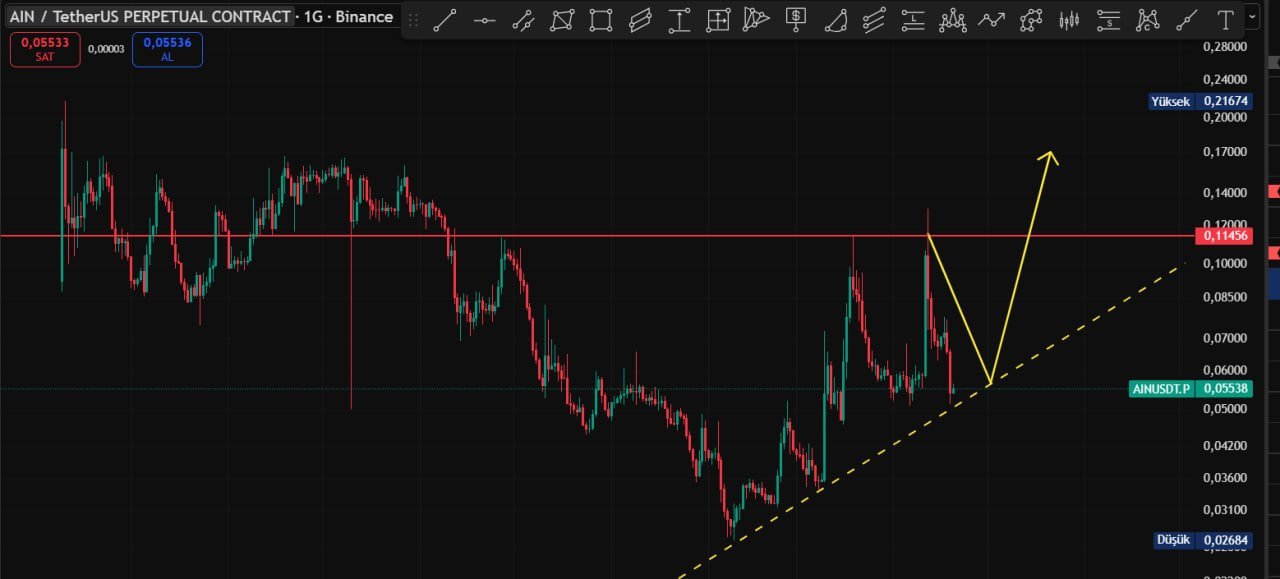
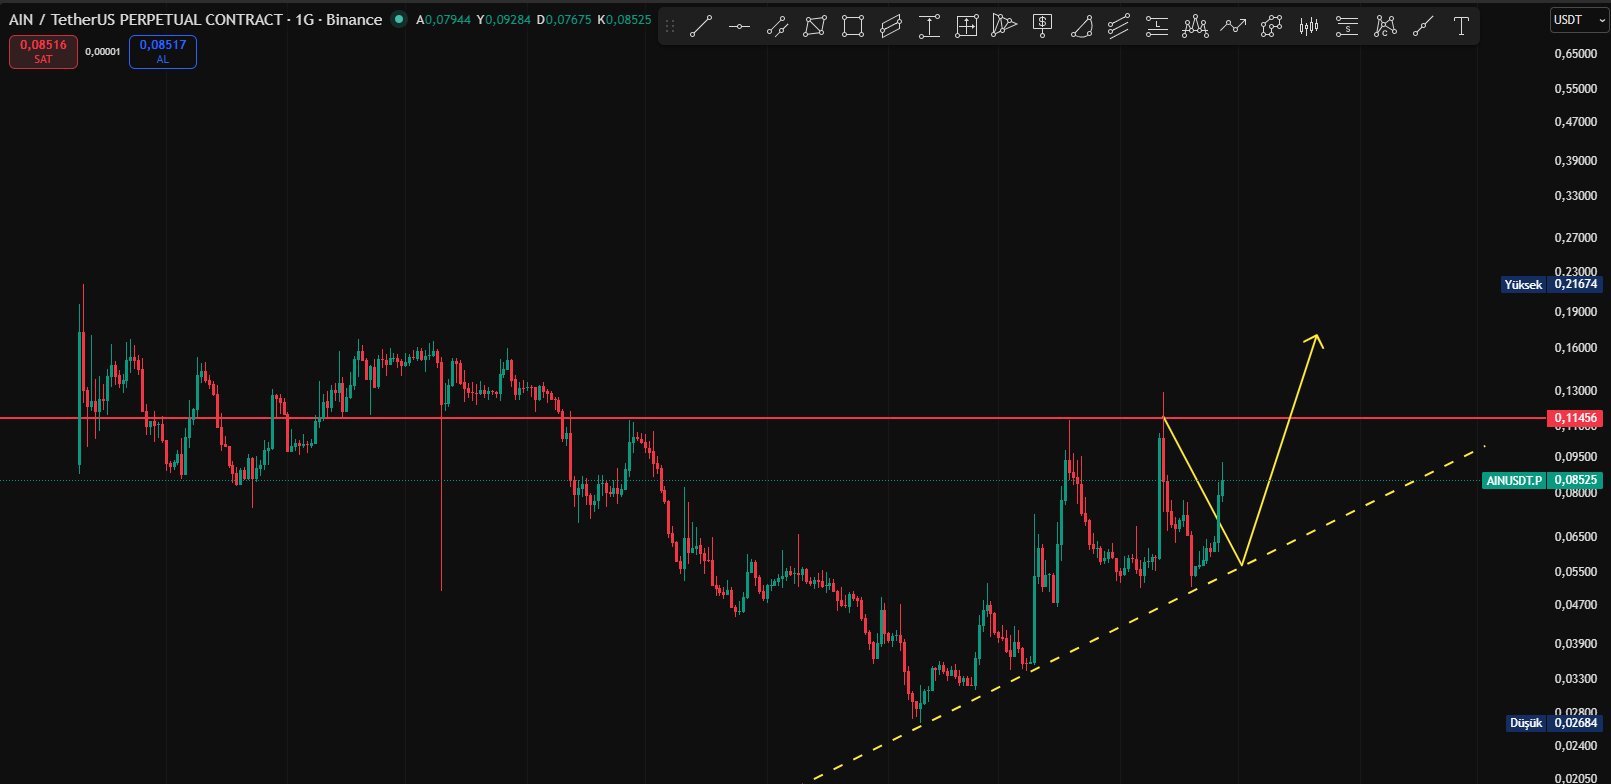
- 釋出後AIN走勢看漲
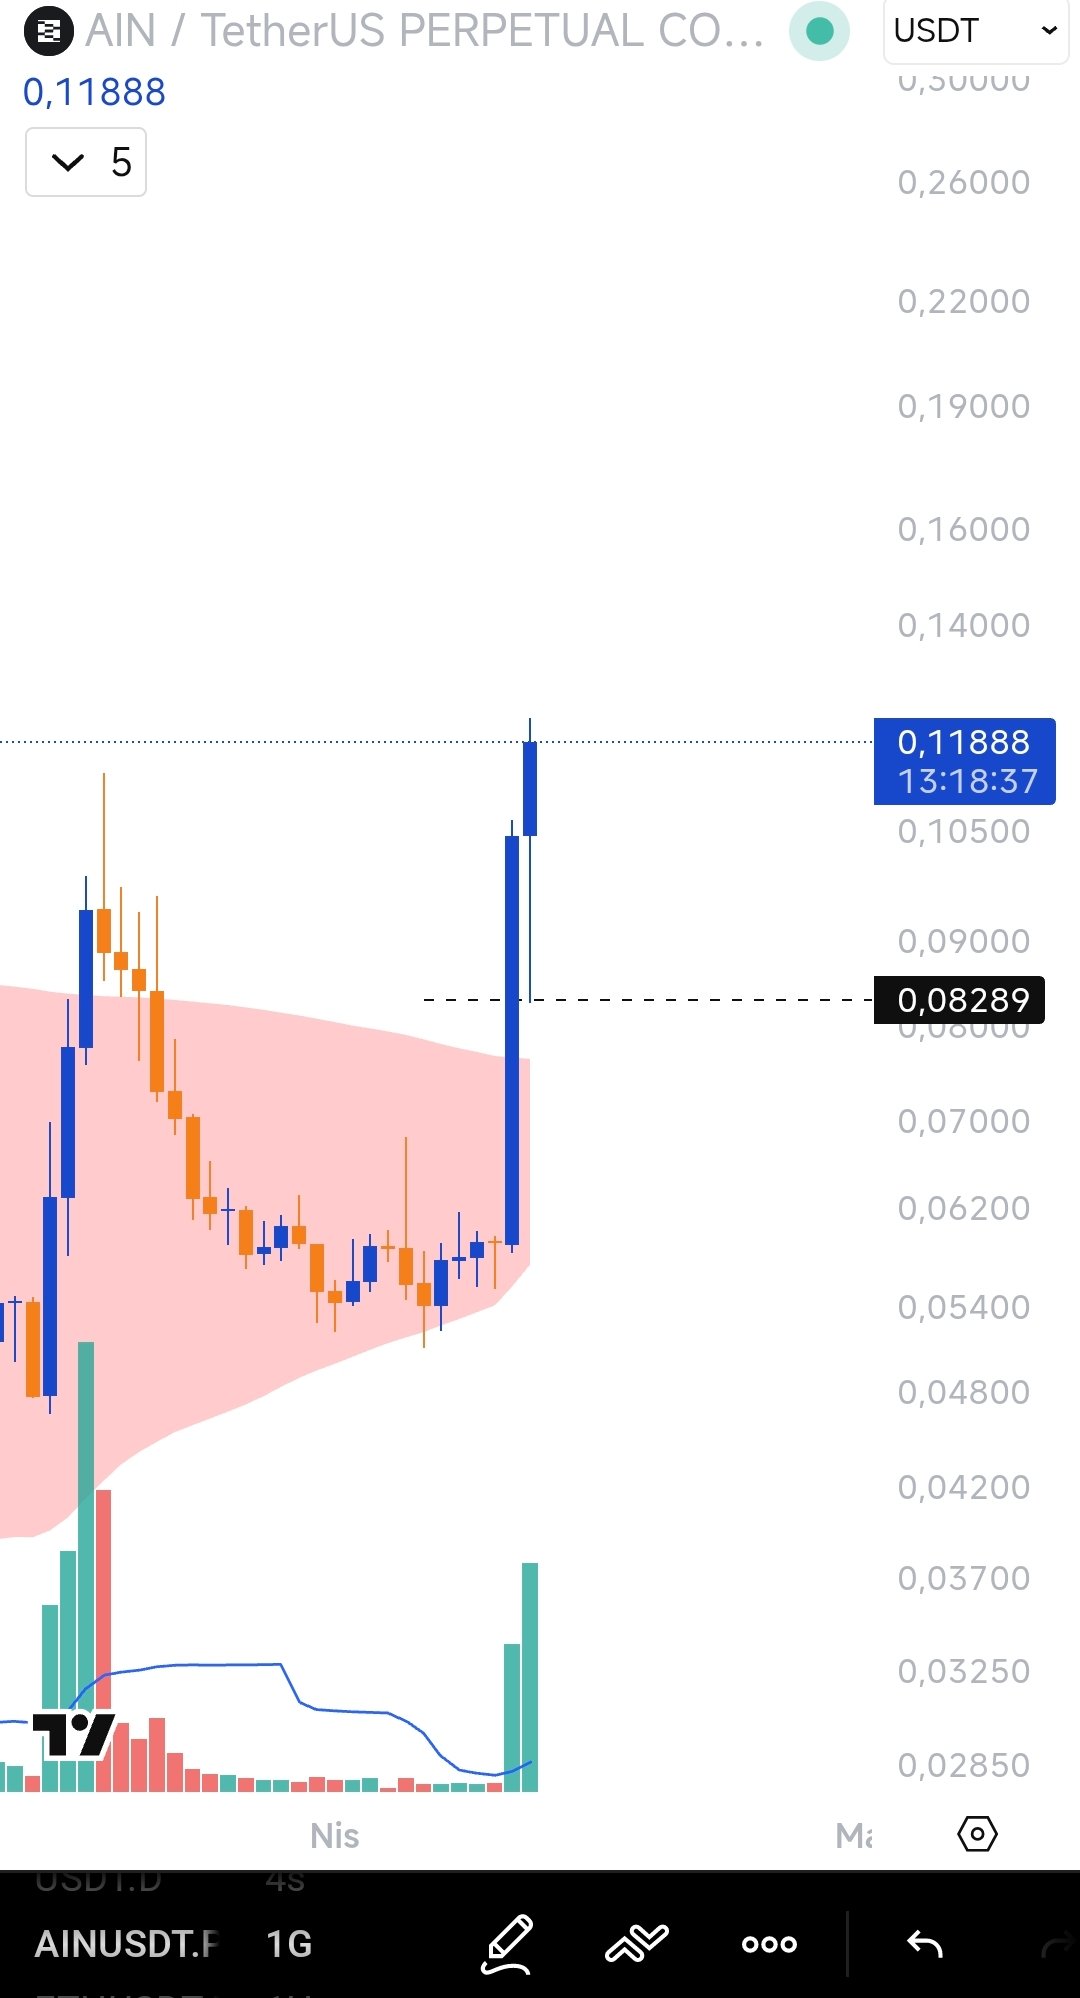
- 釋出後AIN走勢極度看漲
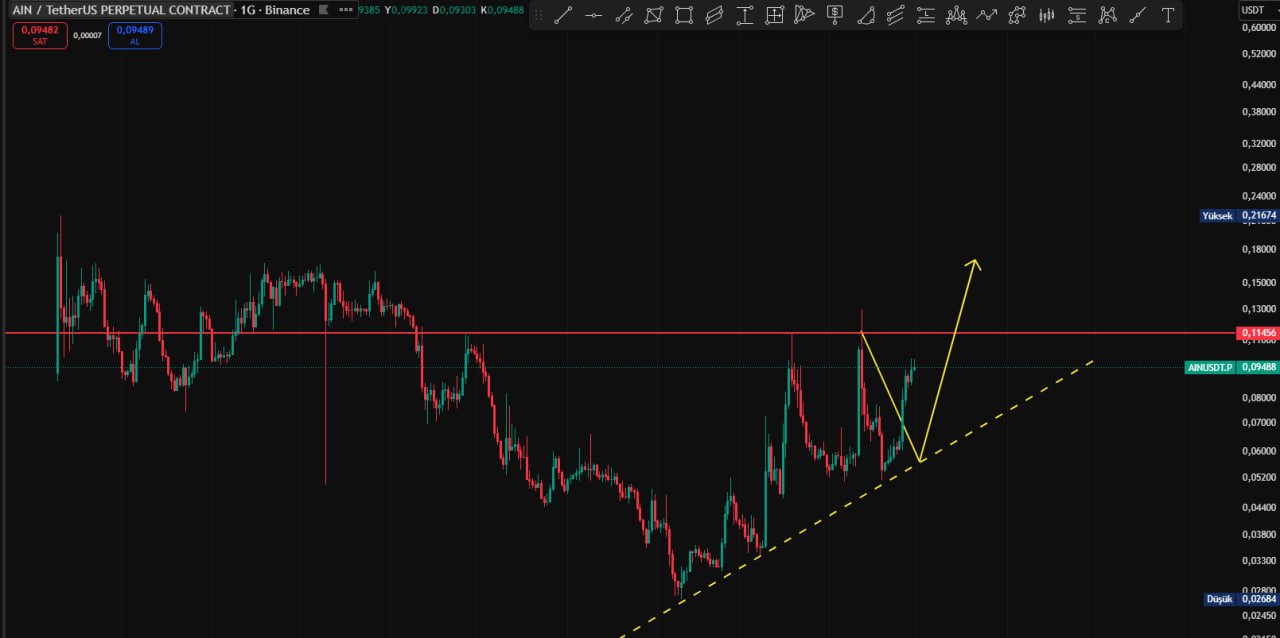
- 釋出後AIN走勢極度看漲
- 釋出後AIN走勢看漲
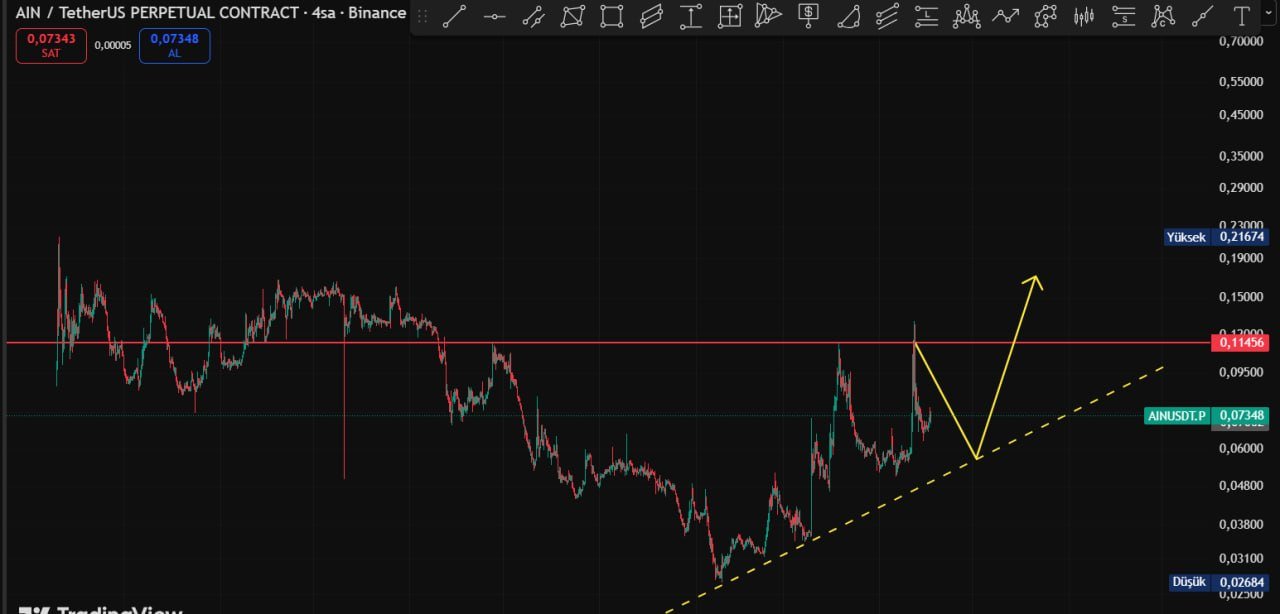
- 釋出後AIN走勢看漲
 Niner 🍡九儿🔶 Trader Quant C123.22K @lijiuer1Niner 🍡九儿🔶 Trader Quant C123.22K @lijiuer1
 91 22 8.26K 閱讀原文 >釋出後AIN走勢中性
- Niner 🍡九儿🔶 Trader Quant C123.22K @lijiuer1Niner 🍡九儿🔶 Trader Quant C123.22K @lijiuer191 22 8.26K 閱讀原文 >釋出後AIN走勢看跌
- 釋出後AIN走勢看漲
- 釋出後AIN走勢看漲
- 釋出後AIN走勢看跌