
📺 Ubisoft shuts Champions Tactics Oct 30 as WEMIX loses $724K to exploit
Learn more about:
Full breakdown 👇
➡️ Watch Video: https://t.co/85N6fwxxcI
Купити криптовалюту
Картка
P2P-торгівля
Купуйте USDT через маркетплейс
Кредитна/дебетова картка
Купуйте криптовалюту за допомогою Visa або MasterCard
Платіж третьої сторони
Купуйте криптовалюту через MoonPay, Simplex та інші сервіси
Картка BitMart
Розширення можливостей вашого криптожиття
Передплачена криптовалютна картка
Миттєво отримайте картку Mastercard для витрат
Торгувати
USDⓈ-M
Використання USDⓈ в якості застави
COIN-M
Використання самої COIN в якості застави
TradFi
Єдине місце для торгівлі металами, акціями та іноземною валютою
Демоторгівля
Дізнайтеся, як торгувати без ризику
Огляд ф'ючерсів
Універсальна платформа для всього, що стосується ф'ючерсів
Futures King
Призовий фонд 478 000 USDT
Примножити
Детальніше про Earn
Заробляйте на невикористаних активах із легкістю
Заощадження
Заробляйте на холдингу.
Стейкінг
Легка ставка, висока винагорода.
Управління капіталом
Примножуйте свій капітал із допомогою провідної команди в галузі управління активами
RWA
Утримуйте BMRUSD — отримуйте дохід
VIP-ексклюзив
Стабільно заробляйте для VIP-користувачів
AI Hub
Rewards
Щоденний розіграш ф’ючерсів
100% шанс на перемогу на щоденних угодах
Щоденний спотовий розіграш
Виграйте головний приз — до 8 888 USDT
Ставка для голосування
Заробіть айрдропи, проголосувавши
Установа
Професійні та ексклюзивні послуги
VIP
Розблокуйте ексклюзивні винагороди
Академія
Швидко дізнайтеся про трейдинг та блокчейн
BitMart Internship
Start your Crypto Career Here
Bitmart подорожі
Універсальні глобальні туристичні послуги
Поповнення мобільного
Швидке і безпечне поповнення мобільного онлайн
Send
Send money globally, fast and secure
BitMart Mall
Заробляйте криптовалюту
WEMIX Дані про ціни в реальному часі
Поточна ціна WEMIX становить $ 0.19 (WEMIX/USD). З ринковою капіталізацією $ 99.85M USD. Обсяг торгів за 24 години: $ 486.32K USD, Зміна ціни за 24 години: +0.00%, І циркулююча пропозиція: 499.36M WEMIX.
WEMIX WEMIX Історія зміни цін USD
Відстежуйте зміну ціни WEMIX за сьогодні та за 7, 30 і 90 днів
Період
Змінити
Зміна (%)
Сьогодні
$ 0
0.00%
7днів
--
--
30днів
--
--
90днів
--
--
Стати власником WEMIX зараз
Купуйте та продавайте WEMIX легко та безпечно на BitMart.
WEMIX Інформація про ринок
$ 0.19 24-годинний діапазон $ 0.19
Найвищий показник за весь час
$ 0
Найнижчий показник за весь час
$ 0
24-годинна зміна
0.00%
24г Vol
$ 486,316.30
Циркуляційний запас
499.36M
WEMIX
Ринкова капіталізація
$ 99.85M
Максимальна пропозиція
0.59B
WEMIX
Повністю розбавлена ринкова капіталізація
$ 117.98M
Торгувати WEMIX
Заробити
Залучайте неактивну криптовалюту до роботи та легко отримуйте пасивний дохід через заощадження, стейкінг та інші послуги.
WEMIX X Інсайт

PlayToEarn
Media
Researcher
D
 83.0K @PlayToEarn
 Надзвичайно ведмежий
WEMIX因漏洞损失724K美元,短期看空
 24
24
 7
7
 8.6K
8.6K
2026-07-31 12:57
Тенденція WEMIX після випуску
Ведмежий
WEMIX因漏洞损失724K美元,短期看空

Kurnia Bijaksana
Trader
Educator
C
46.9K @mkbijaksana Надзвичайно бичачий
The tweet shares an altcoin trading strategy that identifies and follows rising trends when BTC dominance is falling and altcoins are bullish.
Pro tip: If the market is in a condition where
- BTC dominance is falling
- TOTAL2 shows a bullish signal
- Large altcoins are above the 21 EMA on the 1-day timeframe
Check the method below
Kurnia Bijaksana
Trader
Educator
C
46.9K @mkbijaksana DAILY CRYPTO TRADING TUTORIAL: FOLLOW THE TREND (BULLISH)
This method utilizes the follow‑the‑trend principle.
My principle: What goes up will keep going up until a reversal sign appears.
Therefore, we take advantage of assets that are gaining momentum and try to follow their upward move.
Step 1: Market Screening.
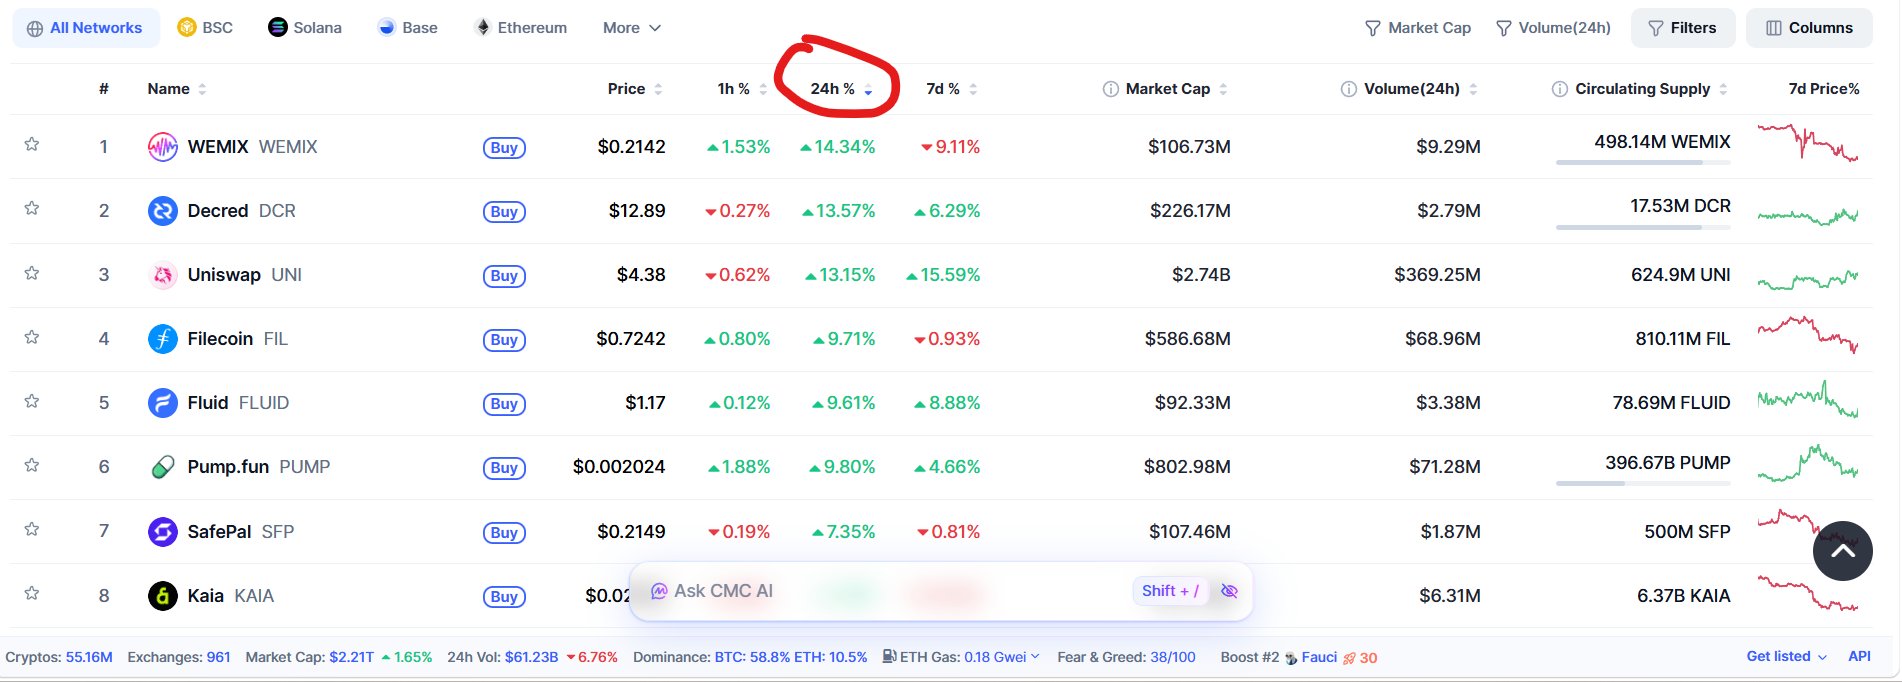
Go to CoinMarketCap, or your favorite exchange. Sort by 24H% or top gainers. You can click the 24H% or %Gains column depending on the exchange, until it lists the highest (see image 1). The example image shows WEMIX, DCR, UNI, among others.
Step 2: Ensure a bullish bias.
Open TradingView (or the exchange you use, on its chart). Switch to the 1‑day timeframe first. Make sure:
- The chart is bullish (green) and
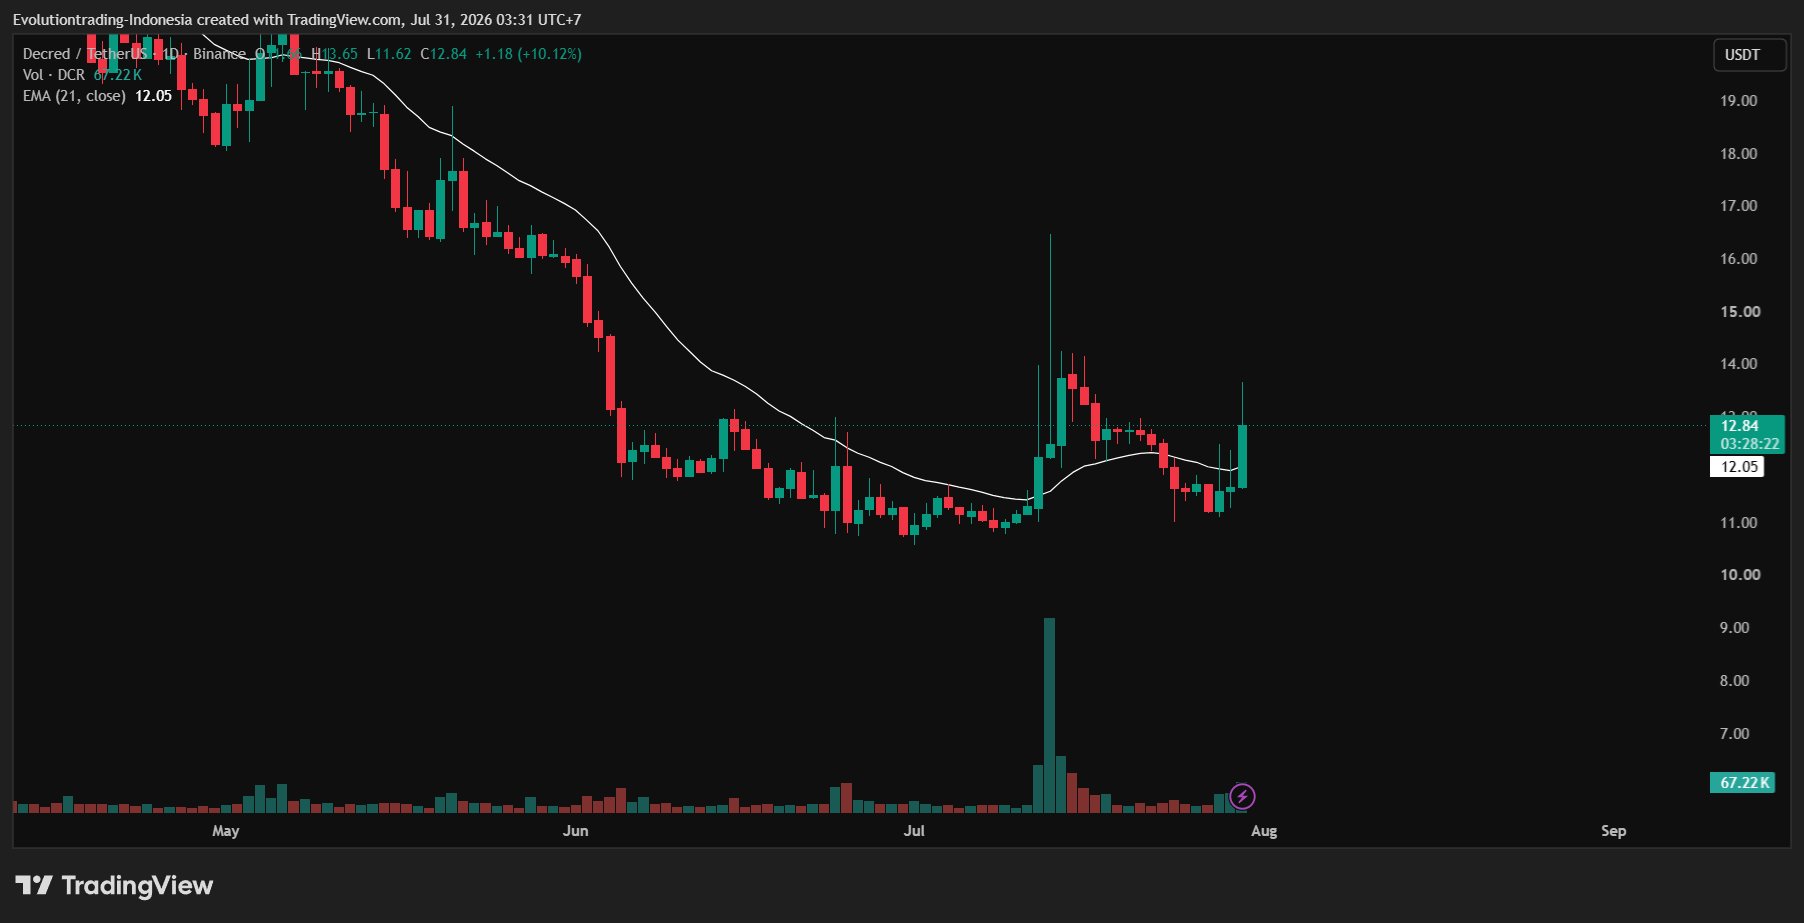
- Not too high. Avoid charts that look like tall pillars on the 1‑day timeframe; they are usually too late.
(See example in image 2)
You can look at several charts, mark those meeting the criteria, then proceed to step 3.
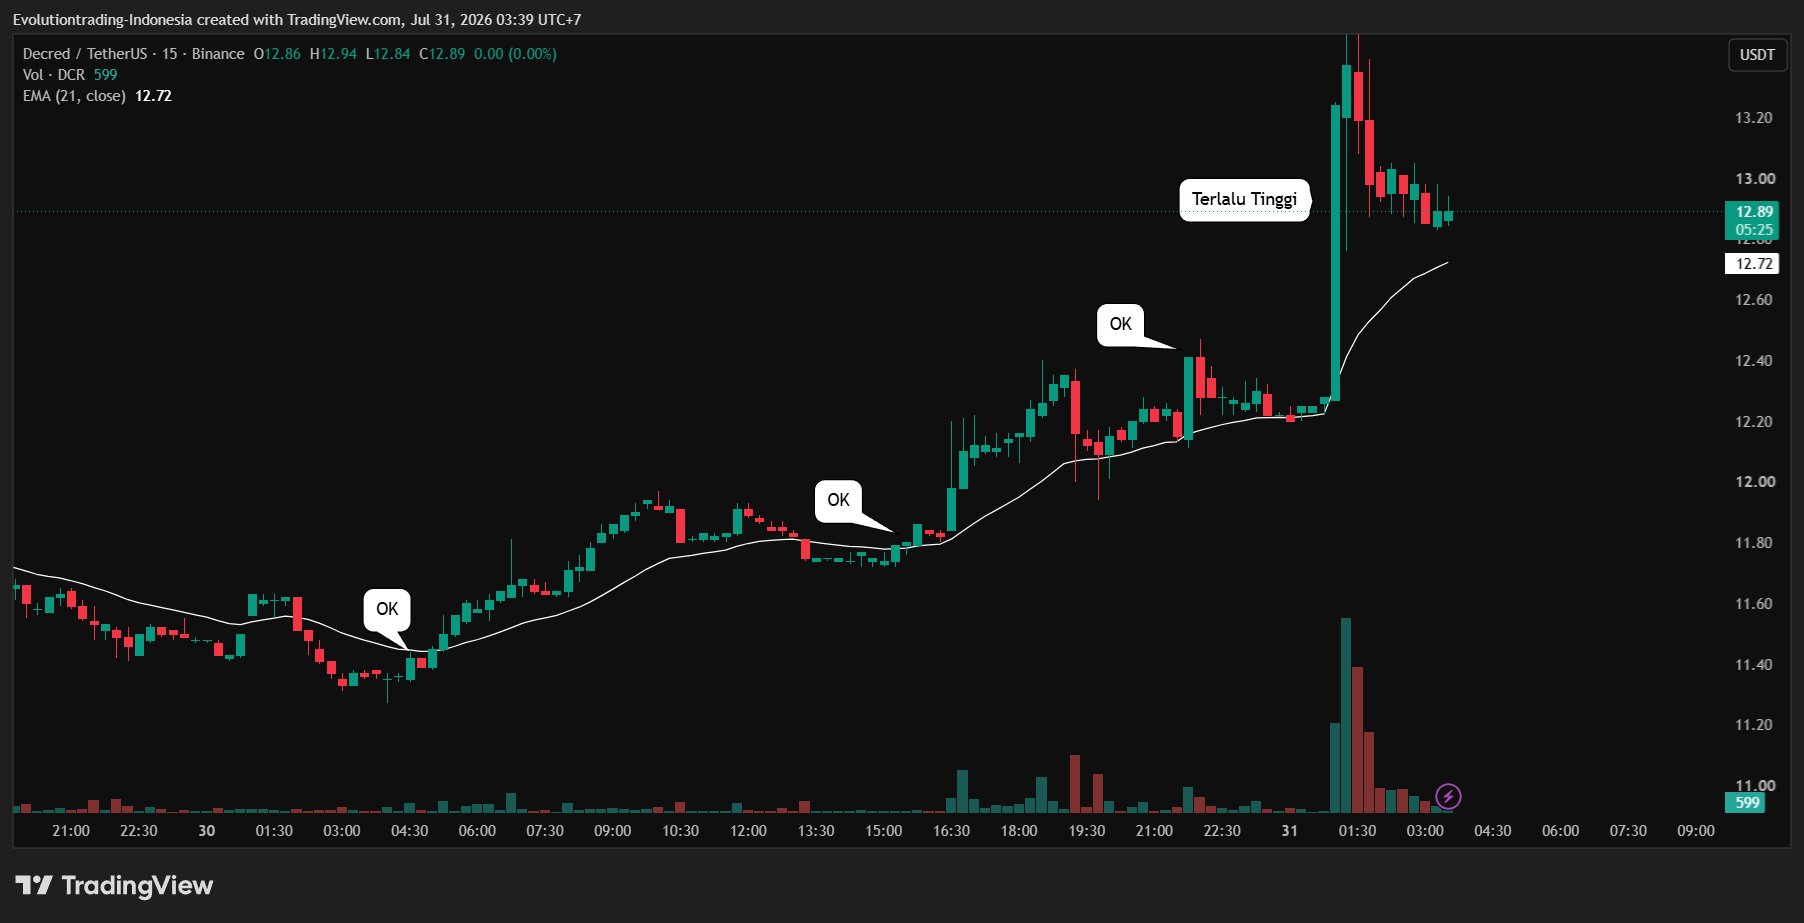
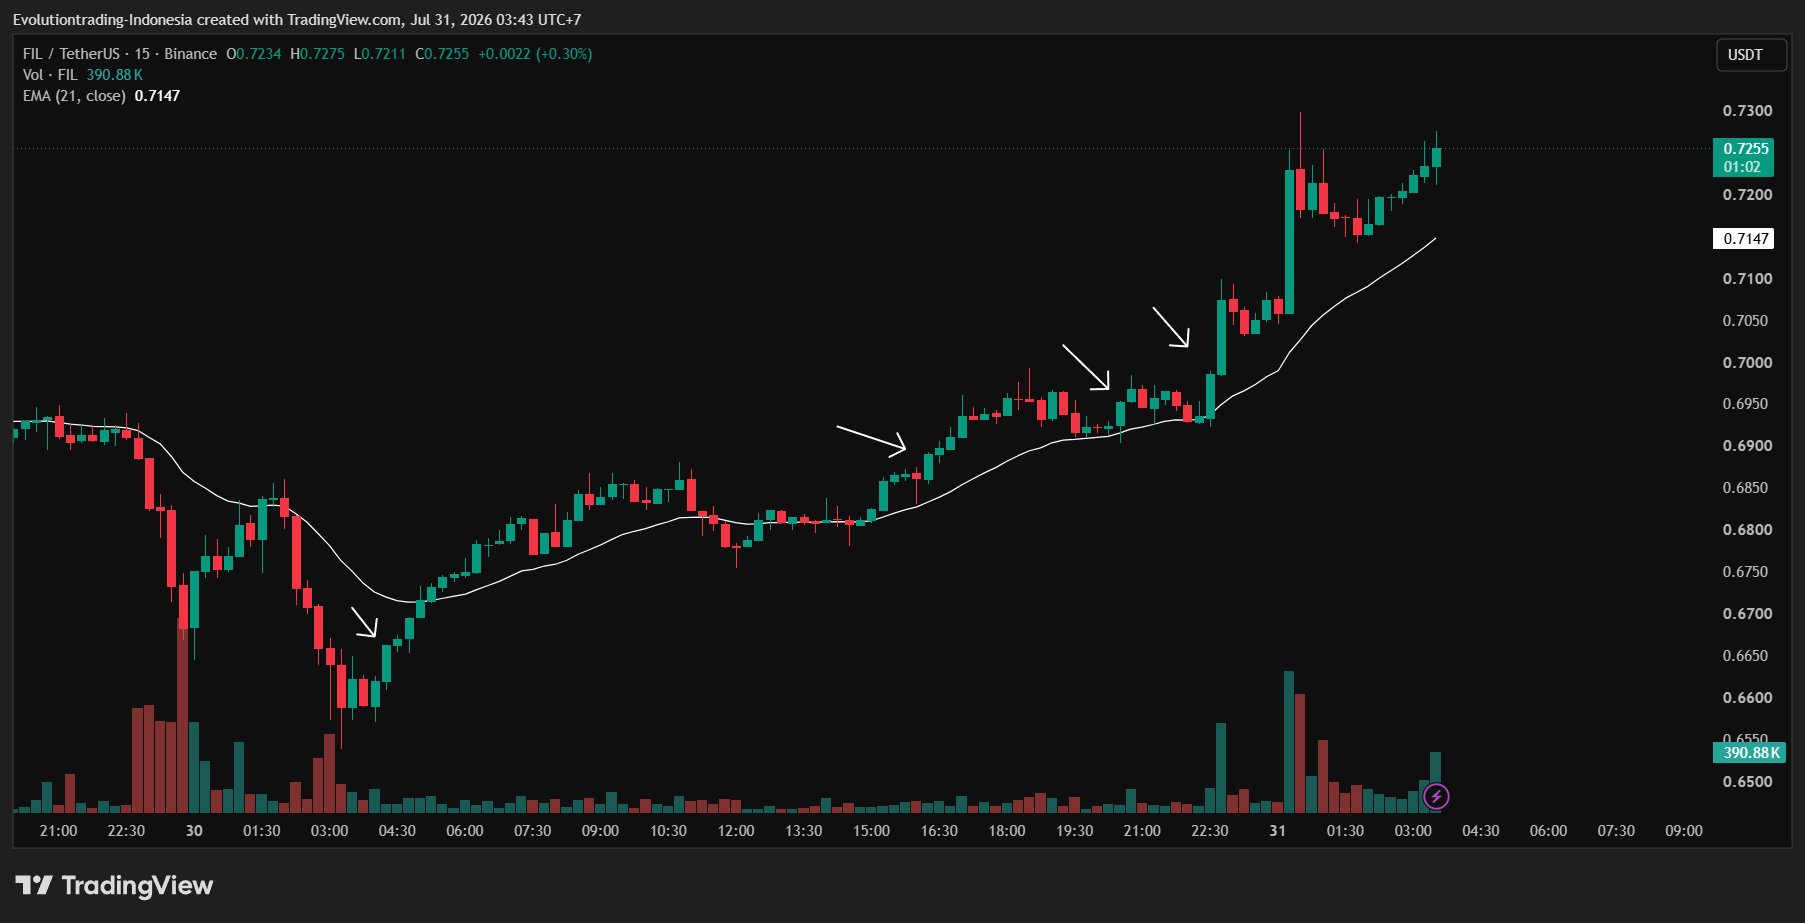
Step 3: Entry Trigger
There are many ways, I will discuss them later.
 21
0
2.3K
21
0
2.3K
2026-07-31 04:57
Тенденція WEMIX після випуску
Надзвичайно бичачий
The tweet shares an altcoin trading strategy that identifies and follows rising trends when BTC dominance is falling and altcoins are bullish.
Kurnia Bijaksana
Trader
Educator
C
46.9K @mkbijaksana Бичачий
The tweet shares an altcoin trading strategy that identifies and follows rising trends when BTC dominance is falling and altcoins are bullish.
DAILY CRYPTO TRADING TUTORIAL: FOLLOW THE TREND (BULLISH)
This method utilizes the follow‑the‑trend principle.
My principle: What goes up will keep going up until a reversal sign appears.
Therefore, we take advantage of assets that are gaining momentum and try to follow their upward move.
Step 1: Market Screening.
Go to CoinMarketCap, or your favorite exchange. Sort by 24H% or top gainers. You can click the 24H% or %Gains column depending on the exchange, until it lists the highest (see image 1). The example image shows WEMIX, DCR, UNI, among others.
Step 2: Ensure a bullish bias.
Open TradingView (or the exchange you use, on its chart). Switch to the 1‑day timeframe first. Make sure:
- The chart is bullish (green) and
- Not too high. Avoid charts that look like tall pillars on the 1‑day timeframe; they are usually too late.
(See example in image 2)
You can look at several charts, mark those meeting the criteria, then proceed to step 3.
Step 3: Entry Trigger
There are many ways, I will discuss them later.
190
6
32.6K
2026-07-31 03:17
Тенденція WEMIX після випуску
Бичачий
The tweet shares an altcoin trading strategy that identifies and follows rising trends when BTC dominance is falling and altcoins are bullish.
Прогноз ціни
Чи зараз слушний час для покупки WEMIX? Чи варто зараз купувати або продавати WEMIX?
Вирішуючи, чи вдалий зараз час для купівлі або продажу WEMIX (WEMIX), важливо спочатку узгодити свою торгову стратегію та профіль ризику.Довгострокові інвестори та короткострокові трейдери часто по-різному інтерпретують ринкові умови, тому ваше рішення має відображати ваш особистий підхід. Згідно з останнім 4-годинним технічним аналізом WEMIX, поточний торговий сигнал — Утримувати.

Прогноз Beacon
Ймовірний прогноз ціни (на найближчі 24 години)Відмова від відповідальності щодо передбачення Beacon
Результати даних, відображені на цій сторінці, аналізуються на основі фактичних торгових даних (OHLCV) обраної торгової пари разом із відповідними технічними показниками.
Цей прогноз є експериментальним технічним продуктом і надається лише для довідки. Він не є інвестиційною порадою. Несподівані події в реальному світі можуть суттєво вплинути на поведінку ринку. Трейдерам слід приймати рішення з обережністю.
Цей прогноз є експериментальним технічним продуктом і надається лише для довідки. Він не є інвестиційною порадою. Несподівані події в реальному світі можуть суттєво вплинути на поведінку ринку. Трейдерам слід приймати рішення з обережністю.
Про WEMIX
WEMIX (WEMIX) is a cryptocurrency launched in 2020. WEMIX has a current supply of 560,158,782.4927065 with 499,361,870.28307045 in circulation. The last known price of WEMIX is 0.19399076 USD and is up 1.22 over the last 24 hours. It is currently trading on 65 active market(s) with $346,636.25 traded over the last 24 hours. More information can be found at http://wemix.com/.
Читати більше
Офіційні посилання
Дослідник ланцюга
Купити WEMIX
Торгувати WEMIX