Comprar criptomoedas
cartão
Negociação P2P
Compre USDT via marketplace
Cartão de Crédito/Débito
Compre criptomoedas com Visa ou Mastercard
Pagamento de terceiros
Compre criptomoedas pela MoonPay, Simplex e outras
Cartão BitMart
Fortalecendo sua jornada no mundo cripto
Cartão Pré-pago de Cripto
Obtenha seu Mastercard utilizável na hora
USDⓈ-M
Usando USDⓈ como garantia
COIN-M
Usando a própria MOEDA como garantia
TradFi
Negociação em um só lugar para metais, ações e forex
Demo de Trading
Aprenda a negociar sem risco
Visão geral dos Futuros
Plataforma única para tudo o que é relacionados aos Futuros
Futures King
478.000 USDT em prêmios
Evoluir
Visão Geral do Earn
Ativos Parados, Ganhos com Facilidade no Earn
Economia
Ganhe juros com participações
Apostando
Aposta fácil, recompensas altas
Gestão de Patrimônio
Evolua seu patrimônio com uma equipe de ativos de alto nível
RWA
Mantenha BMRUSD e Aproveite os Rendimentos
Exclusivo VIP
Ganhos de forma estável para usuários VIP
Rewards
Hub de recompensas
Descubra recompensas exclusivas de até 14.000 USDT
LaunchPrime
Uma plataforma de lançamento de token e NFT
Programa de Afiliados
Entre para ganhar altas comissões
Powerdrop
A Solução de Última Geração para Airdrops já está DISPONÍVEL!
Centro de eventos
Seu Hub para Todas as Operações Comerciais
Sorteio Diário de Futuros
Chance de ganhar em todas as negociações diárias
Sorteio diário Spot
Ganhe 8.888 USDT em Prêmios Incríveis
Stake to vote
Ganhe airdrops votando
Instituição
Serviços profissionais e exclusivos
VIP
Desbloquear recompensas exclusivas
Academia
Aprenda rapidamente sobre trading e blockchain
Estágio na BitMart
Comece sua carreira em cripto aqui
BitMart Travel
Serviços globais de viagem em um só lugar
INO
Uma plataforma de lançamento de NFTs
Faça Stake de BMX para Listagem
Compartilhar taxas de transação
APIS
Estabilidade robusta e inúmeros terminais
Programa de Corretores
Ganhe comissões pela integração da API
Notícias
Últimas notícias e visualizações
NFT MARKETPLACE
Um mercado de NFT como nenhum outro
Recarga de Celular
Recarregue celulares online de forma fácil e segura
Send
Send money globally, fast and secure
BitMart Mall
Viva com cripto

IREN Ltd (Derivatives) (IREN)
$ 46.53 (IREN/USD)
-3.72%
24H
IREN Ltd (Derivatives) IREN Histórico de Preços USD
Acompanhe o preço de IREN Ltd (Derivatives) hoje e nos últimos 7, 30 e 90 dias
Período
Mudar
Alterar (%)
Hoje
$ 1.80
-3.72%
7Dias
$ 10.73
-18.89%
30Dias
$ 8.73
-15.92%
90Dias
$ 8.73
-15.92%
Adquira IREN agora
Compre e venda IREN de forma fácil e segura na BitMart.
IREN Ltd (Derivatives) Informações de mercado
$ 44.36 Intervalo de 24h $ 48.90
Máximo histórico
$ 63.66
Mínimo histórico
$ 43.90
Alteração 24h
-3.72%
24h Vol
$ 0
Fornecimento circulante
0.00
IREN
Capitalização de mercado
$ 0
Fornecimento máximo
--
Capitalização de mercado totalmente diluída
$ 0
Comércio IREN
Ganhar
Coloque suas criptomoedas ociosas para trabalhar e ganhe renda passiva com poupança, staking e muito mais.
IREN Ltd (Derivatives) X Insight

Yimin X
Quant
FA_Analyst
B
 14.5K @yxinsights
 Baixista
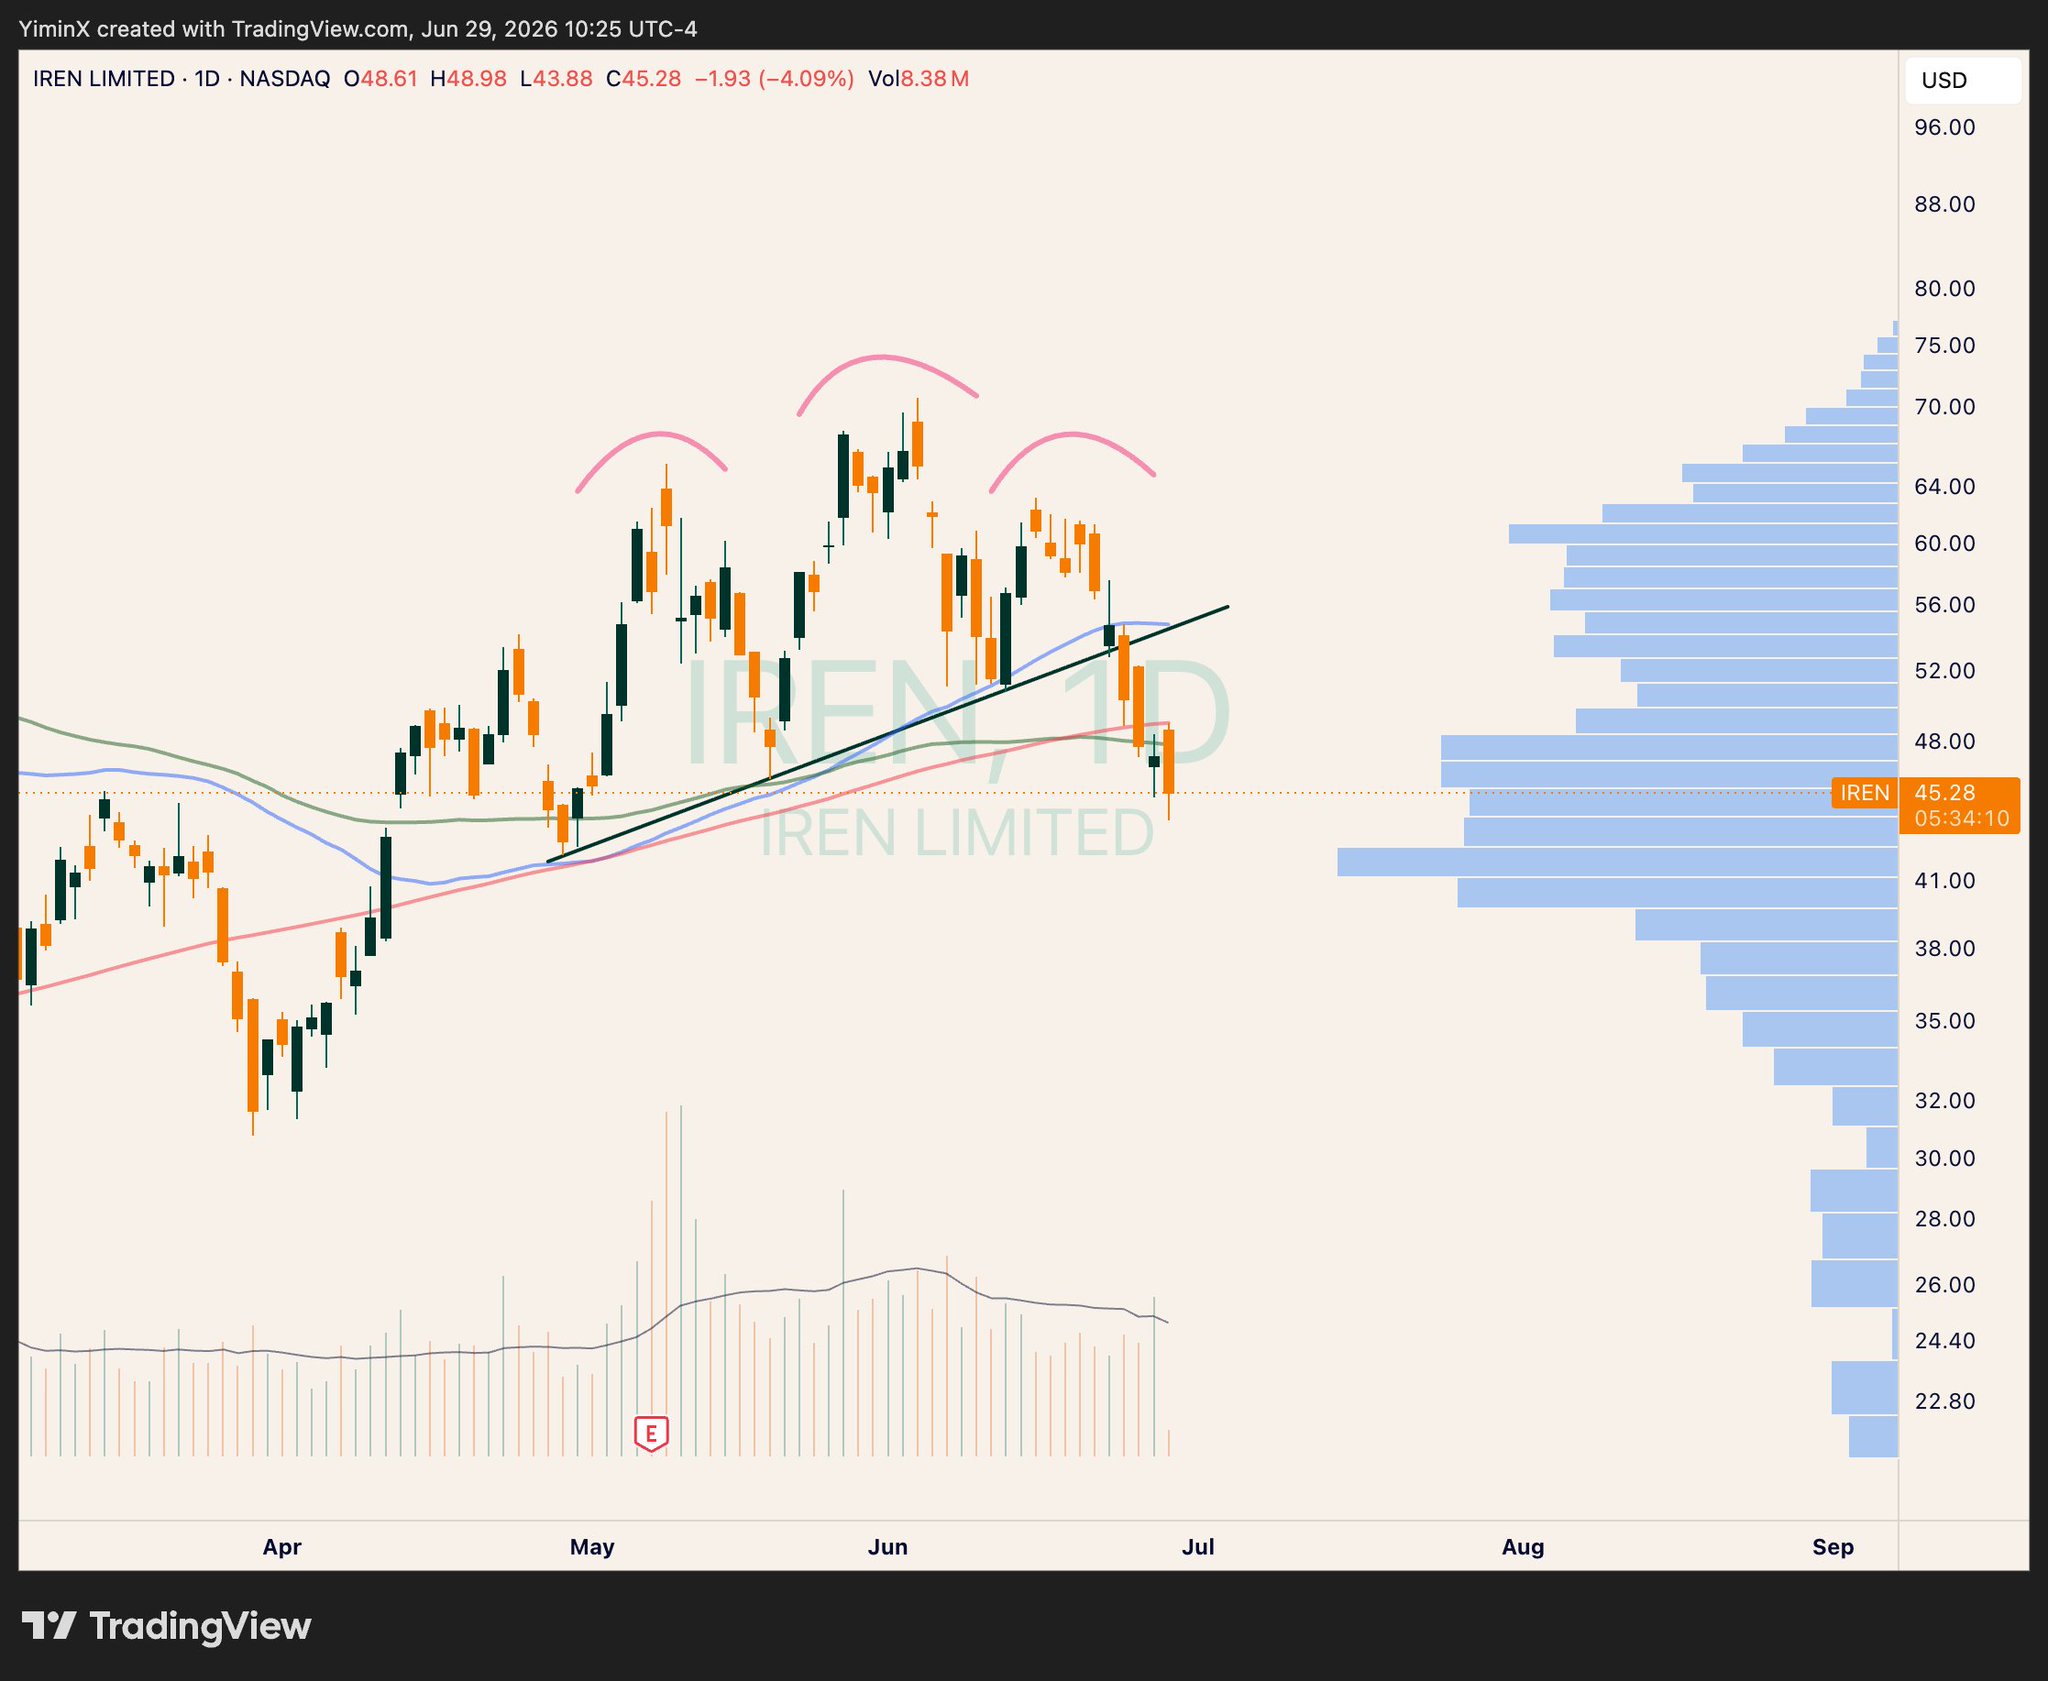
IREN broke below the 200-day moving average, the author stopped out at -18%, and the chart shows a bearish pattern.
Yimin X
Quant
FA_Analyst
B
14.5K @yxinsights Can't say I'm too happy about $IREN.
Lost the 200-day MA and couldn't reclaim it today.
Stopped out after -18% (small position sizing to tolerate the large % loss) https://t.co/tv5S4d44Zg
 16
16
 33
33
 3.8K
3.8K
2026-06-29 18:37
Tendência de IREN após o lançamento
Extremamente Bearish
IREN broke below the 200-day moving average, the author stopped out at -18%, and the chart shows a bearish pattern.
Yimin X
Quant
FA_Analyst
B
14.5K @yxinsights Baixista
IREN broke below the 200-day moving average, the author stopped out at -18%, and the chart shows a bearish pattern.
Can't say I'm too happy about $IREN.
Lost the 200-day MA and couldn't reclaim it today.
Stopped out after -18% (small position sizing to tolerate the large % loss) https://t.co/tv5S4d44Zg
16
33
3.8K
2026-06-29 15:37
Tendência de IREN após o lançamento
Extremamente Bearish
IREN broke below the 200-day moving average, the author stopped out at -18%, and the chart shows a bearish pattern.

🔋Chin🔋
TA_Analyst
Trader
C
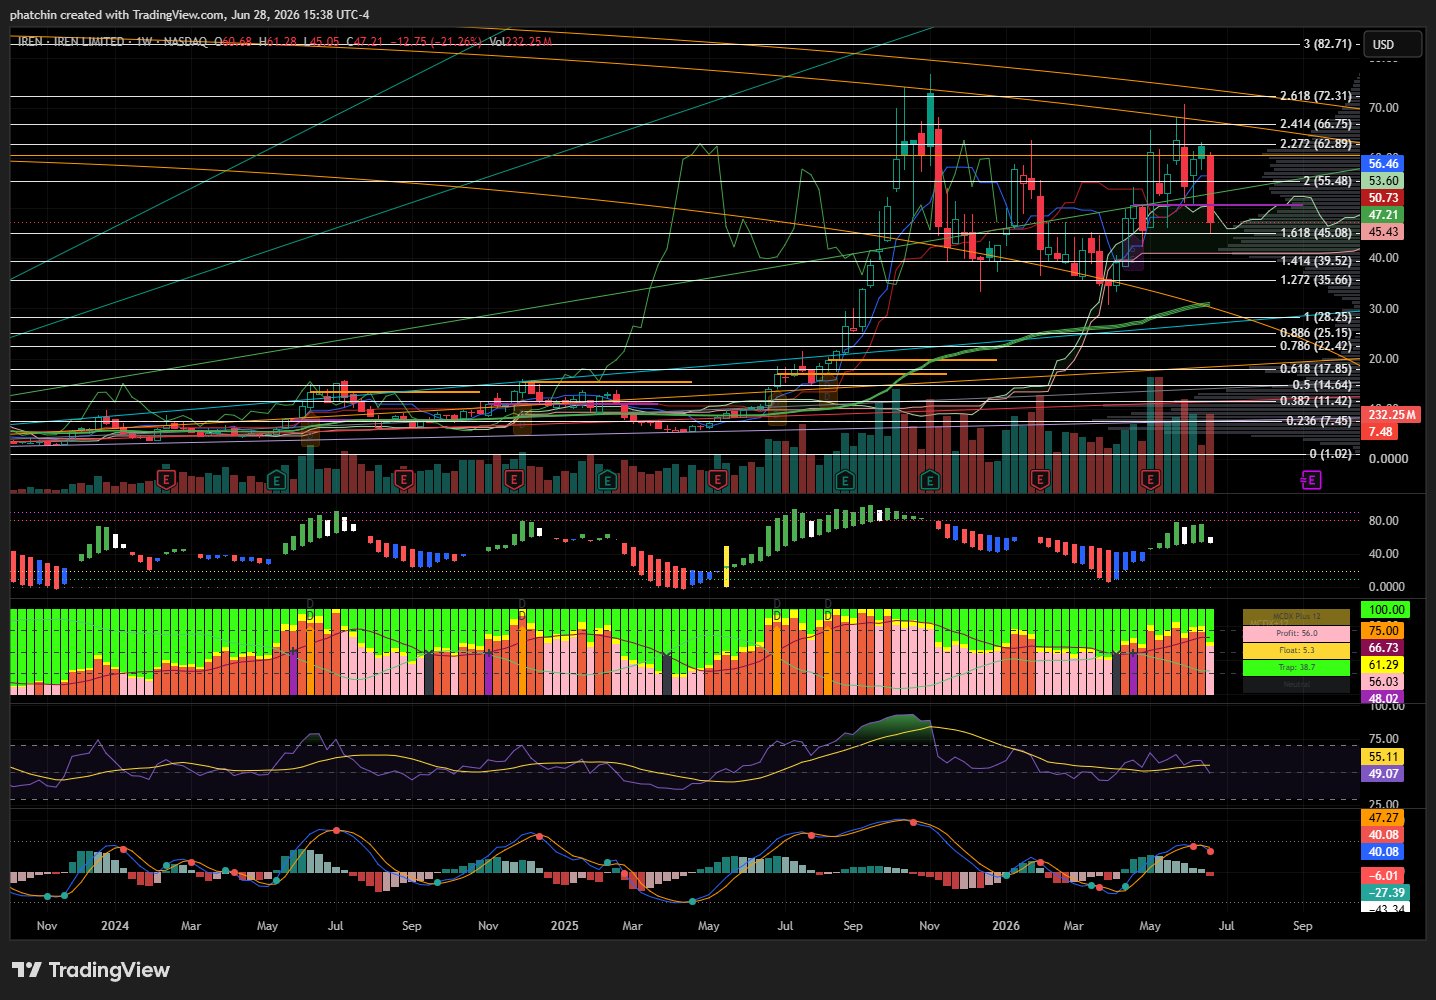
4.0K @PhatChin Extremamente Bearish
IREN retested the Fibonacci 1.618, but indicators are trending downward, MCDX is weak, short-term outlook is not optimistic.
$IREN W 🟥
Price action dutifully back-tested the 1.618 Fib and closed inside the Ichimoku cloud suggests it is ready to explore this Fib level further. Indicators curling down with MCDX going dormant pink is not a good sign. We need the 1.618 to support. https://t.co/s63krXuhC4
 7
0
564
7
0
564
2026-06-28 19:57
Tendência de IREN após o lançamento
Baixista
IREN retested the Fibonacci 1.618, but indicators are trending downward, MCDX is weak, short-term outlook is not optimistic.
Previsão de preço
Quando é um bom momento para comprar IREN? Devo comprar ou vender IREN agora?
Ao decidir se é um bom momento para comprar ou vender IREN Ltd (Derivatives) (IREN), é importante primeiro se alinhar à sua própria estratégia de trading e perfil de risco. Investidores de longo prazo e traders de curto prazo geralmente interpretam as condições de mercado de forma diferente, então sua decisão deve refletir a sua abordagem pessoal. De acordo com a análise técnica de 4 horas mais recente de IREN, o sinal de trading atual é Hold.

Previsão do Beacon
Previsão Probabilística de Preço (Próximas 24 horas)Aviso de Isenção de Responsabilidade de Previsões do Beacon
Os resultados dos dados exibidos nesta página são analisados com base em dados de negociação reais (OHLCV) do par de trading selecionado, juntamente com indicadores técnicos correspondentes.
Esta previsão é um produto técnico experimental, fornecida apenas para fins de referência. Ela não constitui uma orientação de investimento. Eventos inesperados no mundo real podem afetar significativamente o comportamento do mercado. Os traders devem tomar decisões com cautela.
Esta previsão é um produto técnico experimental, fornecida apenas para fins de referência. Ela não constitui uma orientação de investimento. Eventos inesperados no mundo real podem afetar significativamente o comportamento do mercado. Os traders devem tomar decisões com cautela.
Sobre IREN Ltd (Derivatives)
IREN Ltd (Derivatives) (IREN) is a cryptocurrency . IREN Ltd (Derivatives) has a current supply of 0. The last known price of IREN Ltd (Derivatives) is 47.47211414 USD and is down -0.80 over the last 24 hours. It is currently trading on 30 active market(s) with $0.00 traded over the last 24 hours.
Leia mais
Explore Mais
BM Discovery


Nova Listagem

APLDON Applied Digital
-- 0.00%

NEEON NextEra Energy
-- 0.00%

ONON ON Semiconductor Corporation
-- 0.00%

SCHWON The Charles Schwab Corporation
-- 0.00%

ANSEM The Black Bull
-- 0.00%

CIFRON Cipher Mining Inc.
-- 0.00%

WULFON TeraWulf Inc.
-- 0.00%

PINSON Pinterest, Inc.
-- 0.00%

HPEON Hewlett Packard Enterprise Co
-- 0.00%

PCGON PG&E
-- 0.00%