Rewards
Futures Daily Draw
100% Chance To Win With Daily Trades
現物の日次のドロー
Win 8,888 USDT In Grand Prizes
ステークして投票
投票してエアドロップを獲得
機関
プロなかつ専門的なサービス対応
BitMart VIP
限定報酬のロック解除
アカデミー
トレードとブロックチェーンについて
BitMart Internship
Start your Crypto Career Here
BitMart Travel
ワンストップグローバルトラベルサービス
モバイルチャージ
モバイルを簡単に、オンラインで、安全にチャージ
Send
Send money globally, fast and secure
BitMartモール
Live on crypto

IREN Ltd (Derivatives) (IREN)
$ 46.61 (IREN/USD)
-3.53%
24H
IREN Ltd (Derivatives) IREN 価格履歴 USD
IREN Ltd (Derivatives)の今日、7日間、30日間、90日間の価格を追跡
期間
24H変動幅
24H変動率 (%)
本日
$ 1.71
-3.53%
7日
$ 10.73
-18.89%
30日
$ 8.73
-15.92%
90日
$ 8.73
-15.92%
IRENを今すぐ所有
BitMartでIRENを簡単に安全に売買できます。
IREN Ltd (Derivatives) 相場情報
$ 44.36 24H変動幅 $ 48.90
過去最高値
$ 63.66
過去最安値
$ 43.90
24H変動幅
-3.53%
24H取引高
$ 0
供給量
0.00
IREN
時価総額
$ 0
最大供給量
--
完全希薄化後時価総額
$ 0
取引 IREN

IREN Ltd (Derivatives) Xインサイト

Yimin X
Quant
FA_Analyst
B
 14.5K @yxinsights
 弱気
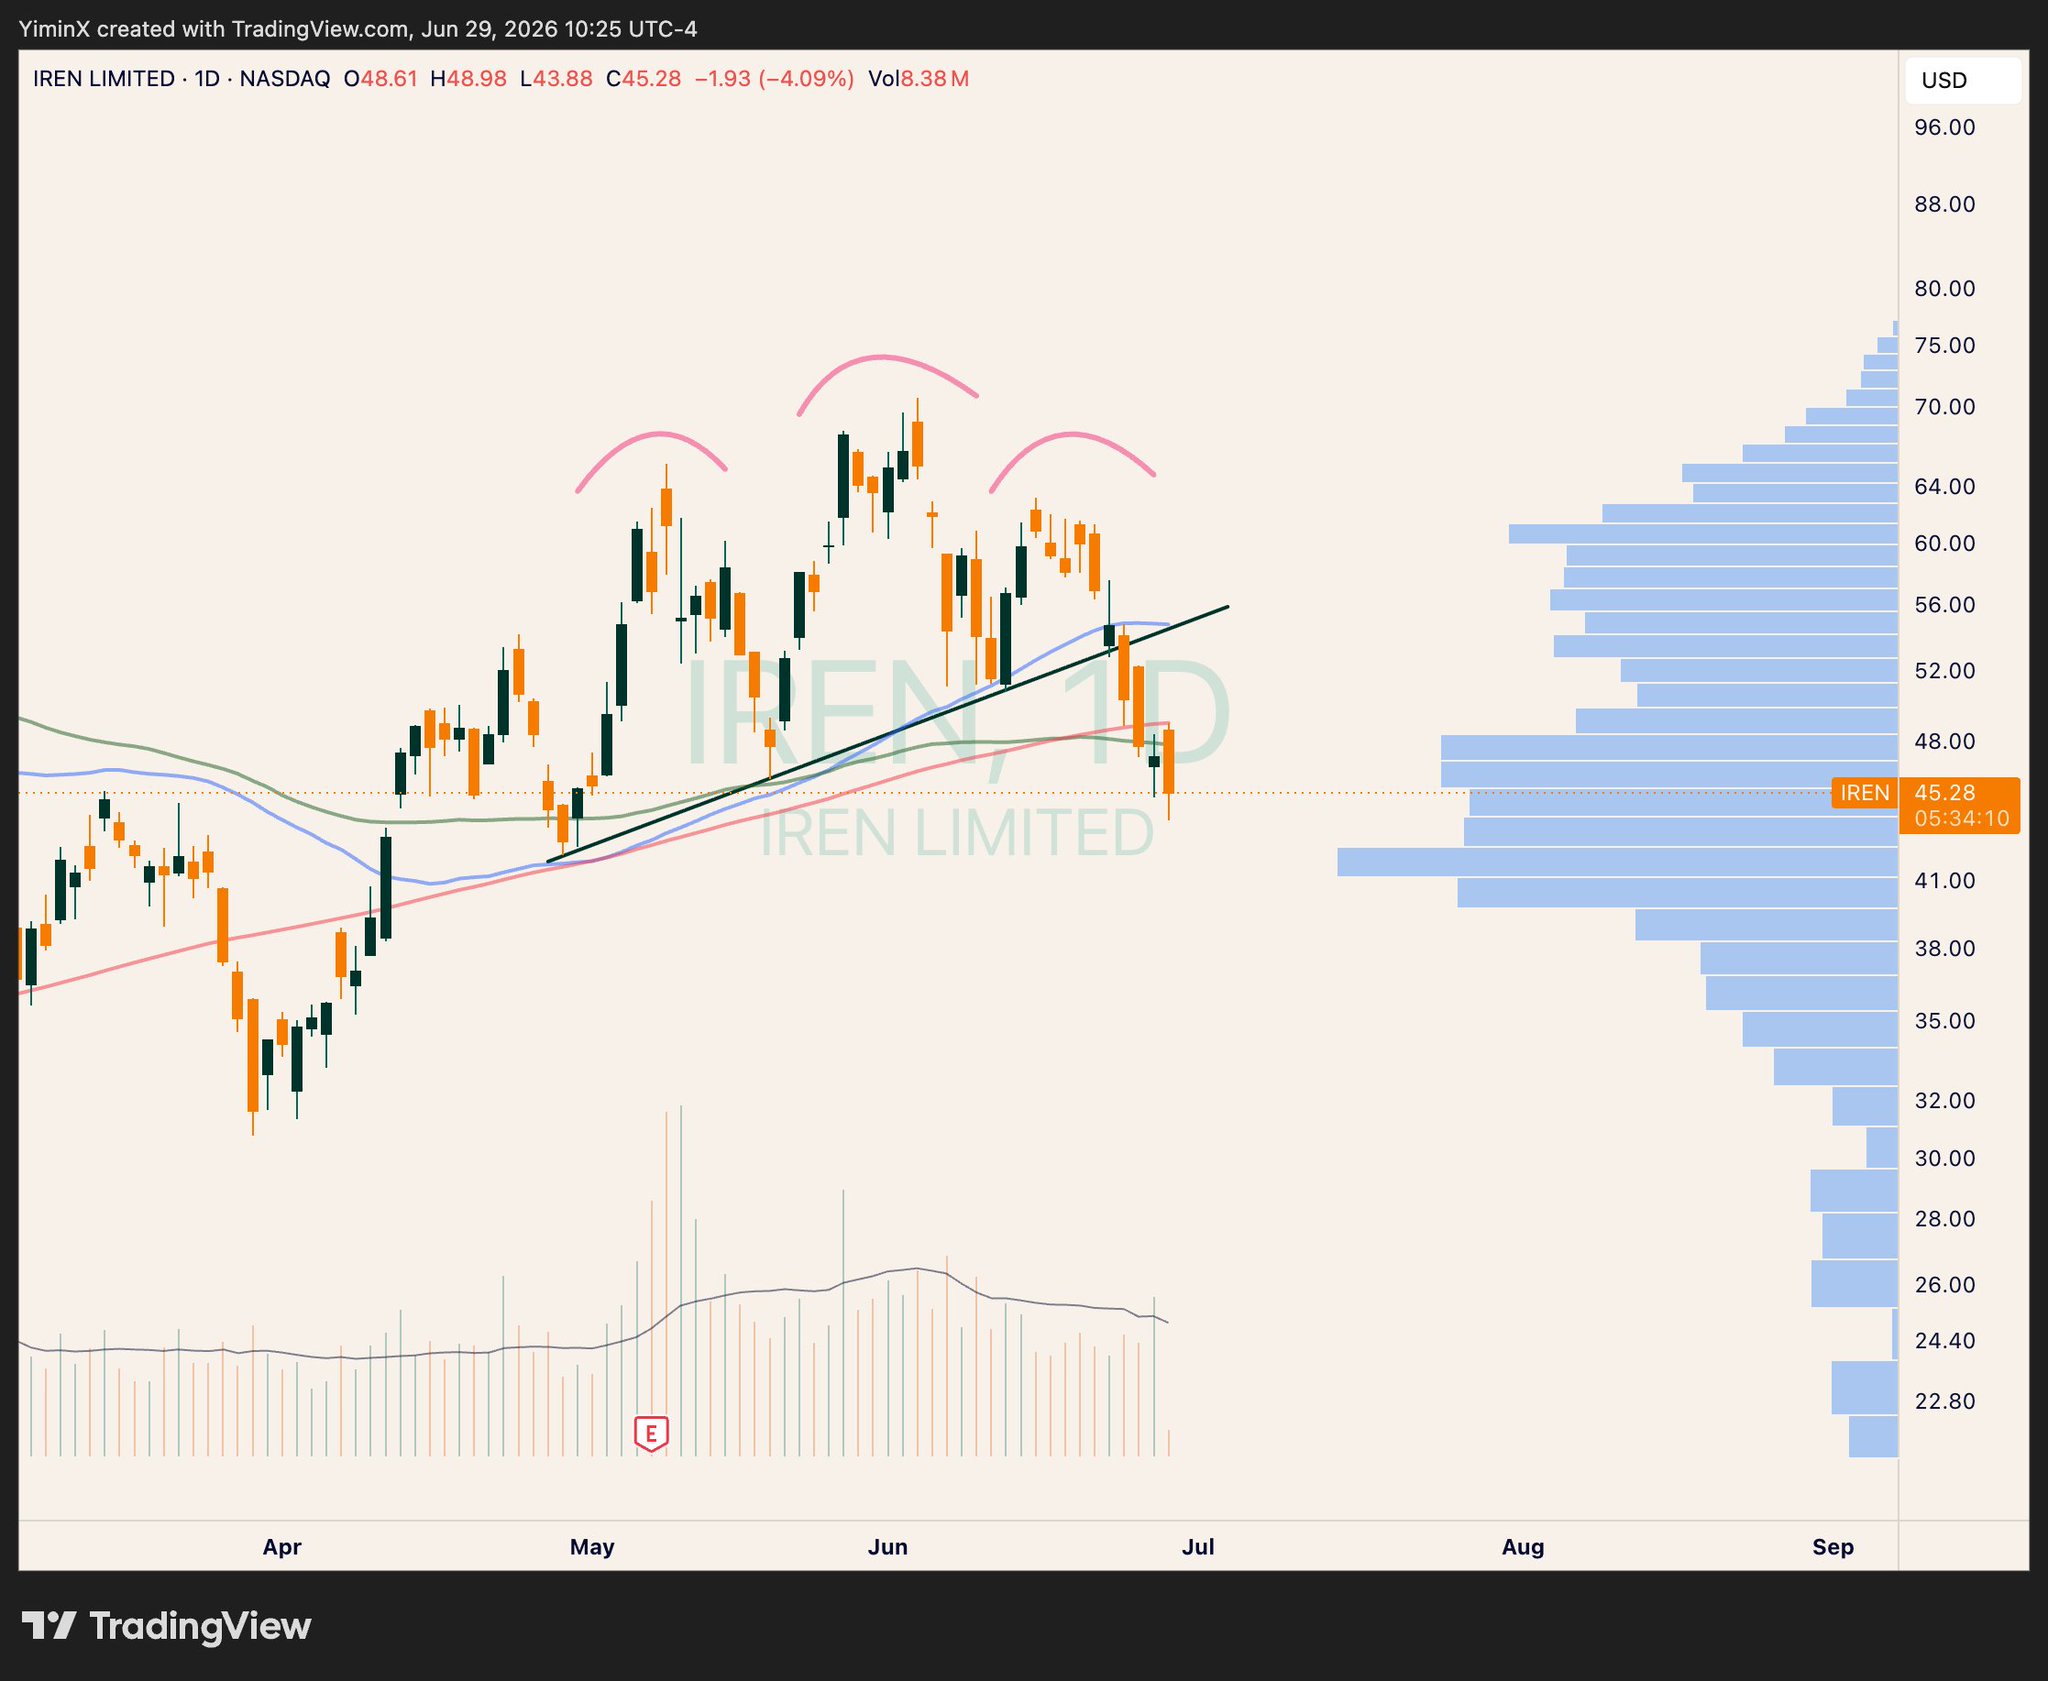
IREN broke below the 200-day moving average, the author stopped out at -18%, and the chart shows a bearish pattern.
Yimin X
Quant
FA_Analyst
B
14.5K @yxinsights Can't say I'm too happy about $IREN.
Lost the 200-day MA and couldn't reclaim it today.
Stopped out after -18% (small position sizing to tolerate the large % loss) https://t.co/tv5S4d44Zg
 16
16
 33
33
 3.8K
3.8K
2026-06-29 18:37
リリース後のIRENのトレンド
非常に弱気
IREN broke below the 200-day moving average, the author stopped out at -18%, and the chart shows a bearish pattern.
Yimin X
Quant
FA_Analyst
B
14.5K @yxinsights 弱気
IREN broke below the 200-day moving average, the author stopped out at -18%, and the chart shows a bearish pattern.
Can't say I'm too happy about $IREN.
Lost the 200-day MA and couldn't reclaim it today.
Stopped out after -18% (small position sizing to tolerate the large % loss) https://t.co/tv5S4d44Zg
16
33
3.8K
2026-06-29 15:37
リリース後のIRENのトレンド
非常に弱気
IREN broke below the 200-day moving average, the author stopped out at -18%, and the chart shows a bearish pattern.

🔋Chin🔋
TA_Analyst
Trader
C
4.0K @PhatChin 非常に弱気
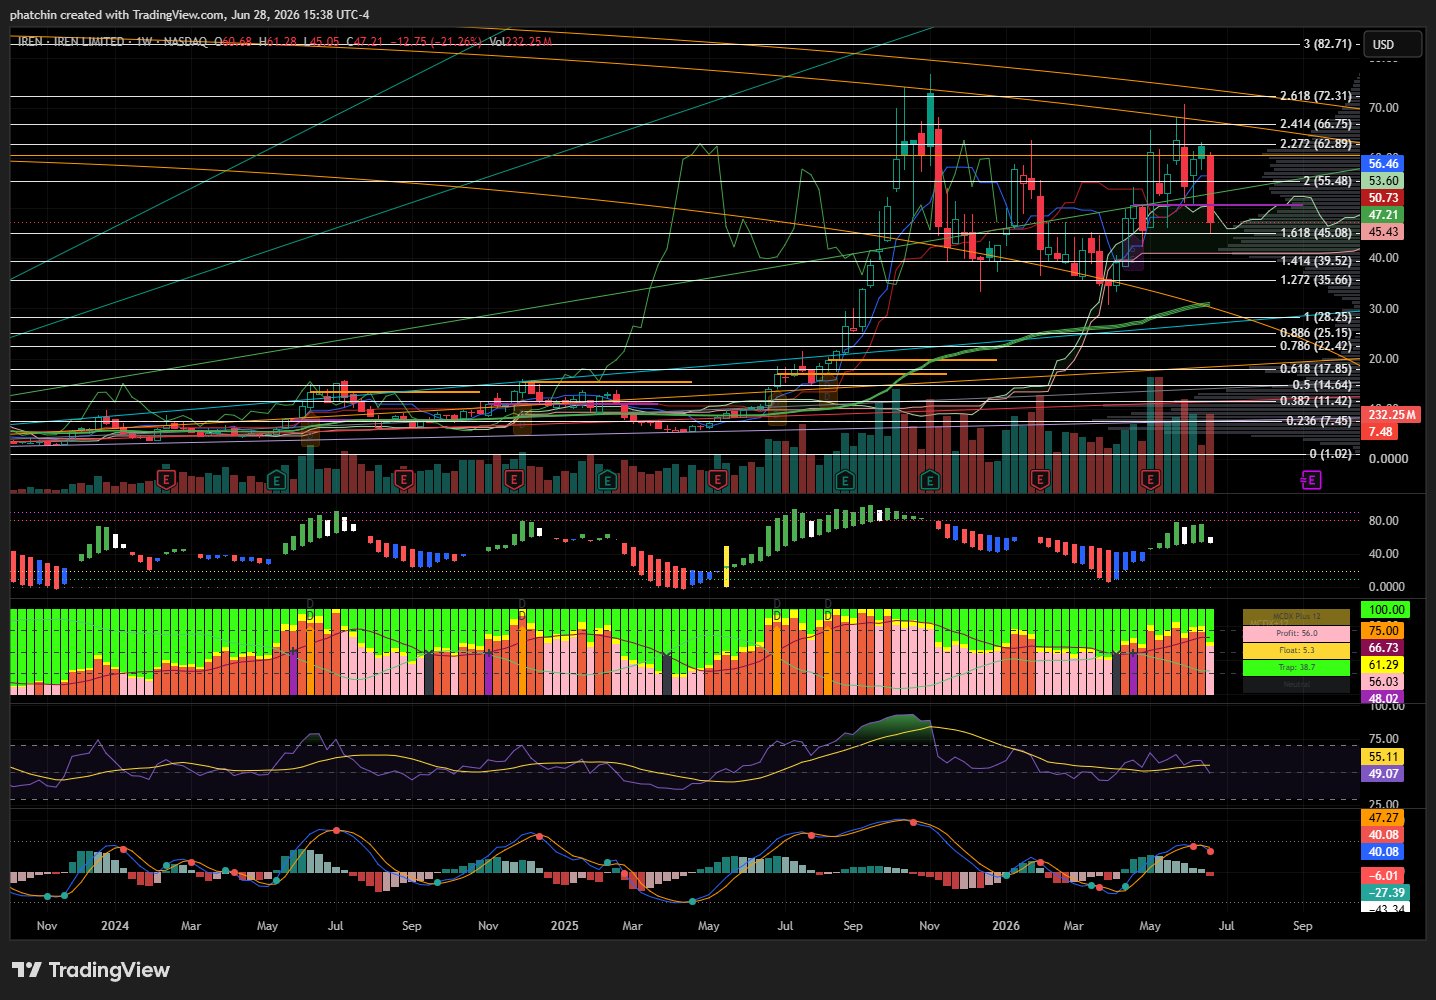
IREN retested the Fibonacci 1.618, but indicators are trending downward, MCDX is weak, short-term outlook is not optimistic.
$IREN W 🟥
Price action dutifully back-tested the 1.618 Fib and closed inside the Ichimoku cloud suggests it is ready to explore this Fib level further. Indicators curling down with MCDX going dormant pink is not a good sign. We need the 1.618 to support. https://t.co/s63krXuhC4
 7
0
564
7
0
564
2026-06-28 19:57
リリース後のIRENのトレンド
弱気
IREN retested the Fibonacci 1.618, but indicators are trending downward, MCDX is weak, short-term outlook is not optimistic.
価格予測
IRENを購入するのに良い時期はいつですか?IRENは今買いでしょうか、売りでしょうか?
IREN Ltd (Derivatives)(IREN)を購入または売却する適切な時期を決定する際は、まずご自身の取引戦略とリスクプロファイルに合わせることが重要です。長期投資家と短期トレーダーは市場状況を異なる方法で解釈することが多いため、決定には個人的なアプローチを反映すべきです。 最新の IREN 4時間テクニカル分析によると、現在の取引シグナルは ホールド です。

ビーコン予測
の確率的価格予測(今後24時間)ビーコン予測に関する免責事項
このページに表示されるデータ結果は、選択した取引ペアの実際の取引データ(OHLCV)と対応するテクニカル指標に基づいて分析されています。
この予測は実験的な技術的成果であり、あくまで参考目的で提供しています。これは投資アドバイスをではありません。現実世界での予期せぬ出来事が市場行動に大きな影響を与える可能性があります。トレーダーは慎重に意思決定を行うべきです。
この予測は実験的な技術的成果であり、あくまで参考目的で提供しています。これは投資アドバイスをではありません。現実世界での予期せぬ出来事が市場行動に大きな影響を与える可能性があります。トレーダーは慎重に意思決定を行うべきです。
アプリバージョン IREN Ltd (Derivatives)
IREN Ltd (Derivatives) (IREN) is a cryptocurrency . IREN Ltd (Derivatives) has a current supply of 0. The last known price of IREN Ltd (Derivatives) is 47.47211414 USD and is down -0.80 over the last 24 hours. It is currently trading on 30 active market(s) with $0.00 traded over the last 24 hours.
続きを読む
さらに詳しく
BM Discovery


新規上場

APLDON Applied Digital
-- 0.00%

NEEON NextEra Energy
-- 0.00%

ONON ON Semiconductor Corporation
-- 0.00%

SCHWON The Charles Schwab Corporation
-- 0.00%

ANSEM The Black Bull
-- 0.00%

CIFRON Cipher Mining Inc.
-- 0.00%

WULFON TeraWulf Inc.
-- 0.00%

PINSON Pinterest, Inc.
-- 0.00%

HPEON Hewlett Packard Enterprise Co
-- 0.00%

PCGON PG&E
-- 0.00%