Se lancer
Scanner pour télécharger l'application
iOS et Android
BitMart / Crypto / RENDER

Render (RENDER)

$
$ 1.27 (RENDER/USD)
0.79%
24H

Render Données sur les prix en temps réel

Le prix de Render aujourd'hui est $ 1.27 (RENDER/USD). Avec une capitalisation boursière de $ 658.29M USD. Volume de trading de $ 15.42M USD sur 24 heures, Un changement de prix de +0.79% sur 24 heures, Et une réserve circulante de 518.77M RENDER.

Render RENDER Historique des prix USD

Suivez le prix de Render aujourd’hui, dans 7 jours, 30 jours et 90 jours
Période
Modifier
Variation (en pourcentage)
Aujourd'hui
$ 0.0099
0.79%
7Jours
--
--
30Jours
--
--
90Jours
--
--

Possédez RENDER dès maintenant

Achetez et vendez RENDER facilement et en toute sécurité sur BitMart.
Acheter/vendre RENDER maintenant
Acheter/vendre {0} maintenant
Render Informations sur le marché
Dernier prix $ 1.27
$ 1.24 Fourchette de prix sur 24 heures $ 1.27
Record absolu
‎$ 0‎
Plus bas niveau jamais atteint
‎$ 0‎
Variation sur 24 heures
‎0.79%‎
Volume sur 24 h
‎$ 15,419,180.22‎
Approvisionnement en circulation
0.51B RENDER
Capitalisation boursière
‎$ 658.29M‎
Approvisionnement maximal
0.64B RENDER
Capitalisation boursière entièrement diluée
‎$ 817.41M‎
Trader RENDER

Gagner

Faites fructifier vos cryptomonnaies et générez des revenus passifs grâce à l'épargne, au staking, et plus encore.
Essayez maintenant
Essayez maintenant

Render X Insight

avatar
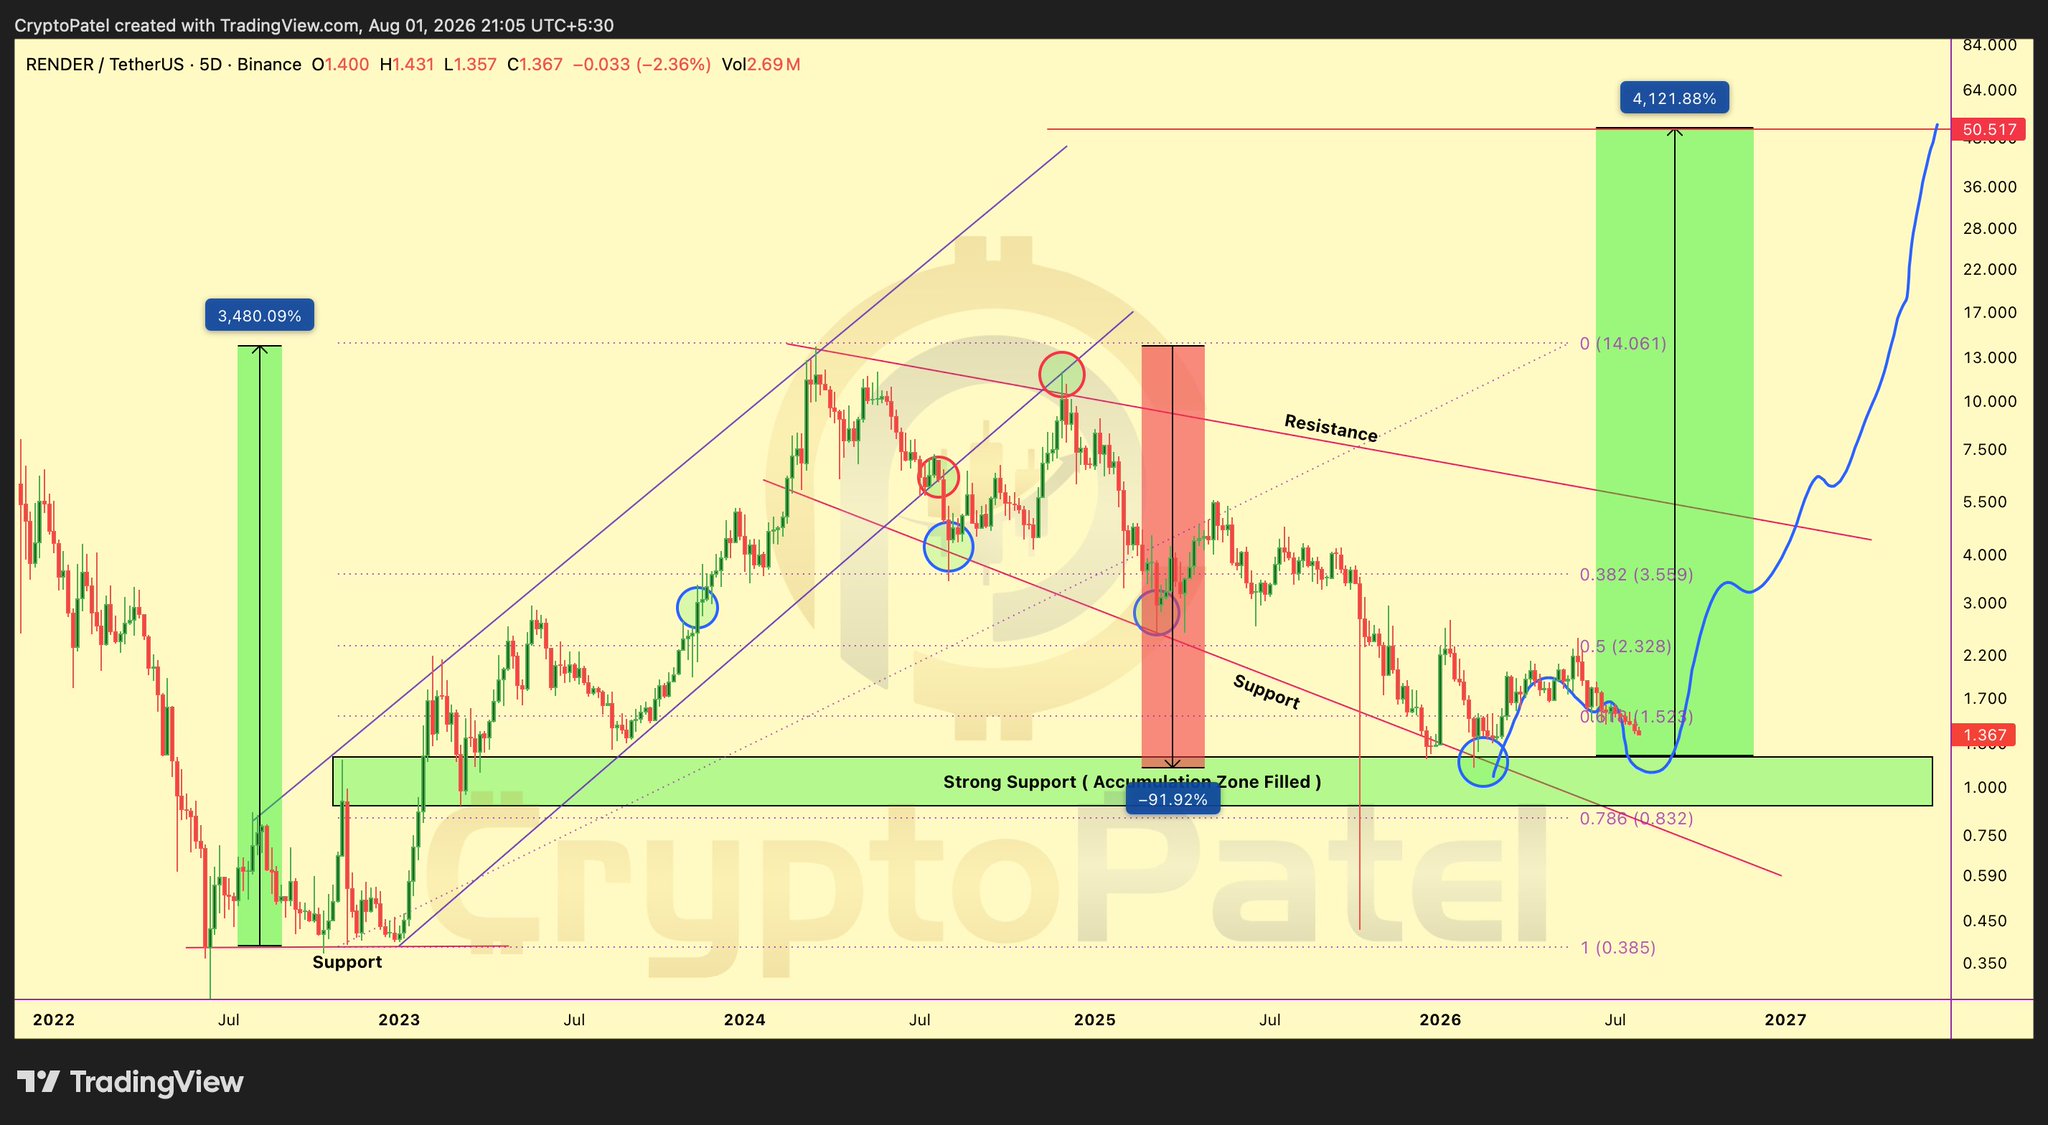
RENDER is in an accumulation zone, with limited downside and huge upside potential, target price $10-$50.

$RENDER is back in the same HTF Accumulation zone that fueled its previous parabolic rally

After a 92%+ correction, downside looks increasingly limited while the upside remains massive. If this support holds, the next major move could catch most people completely off guard. 🚀

Accumulation Zone: $1.35-$0.90
Targets: $10 | $20 | $30 | $50
Stop Loss: HTF Close Below $0.70

NFA & Always DYOR

@render
view 282
view 23
view 31.2K
2026-08-02 05:37
Tendance de RENDER après le lancement
Extrêmement haussier
RENDER is in an accumulation zone, with limited downside and huge upside potential, target price $10-$50.
avatar
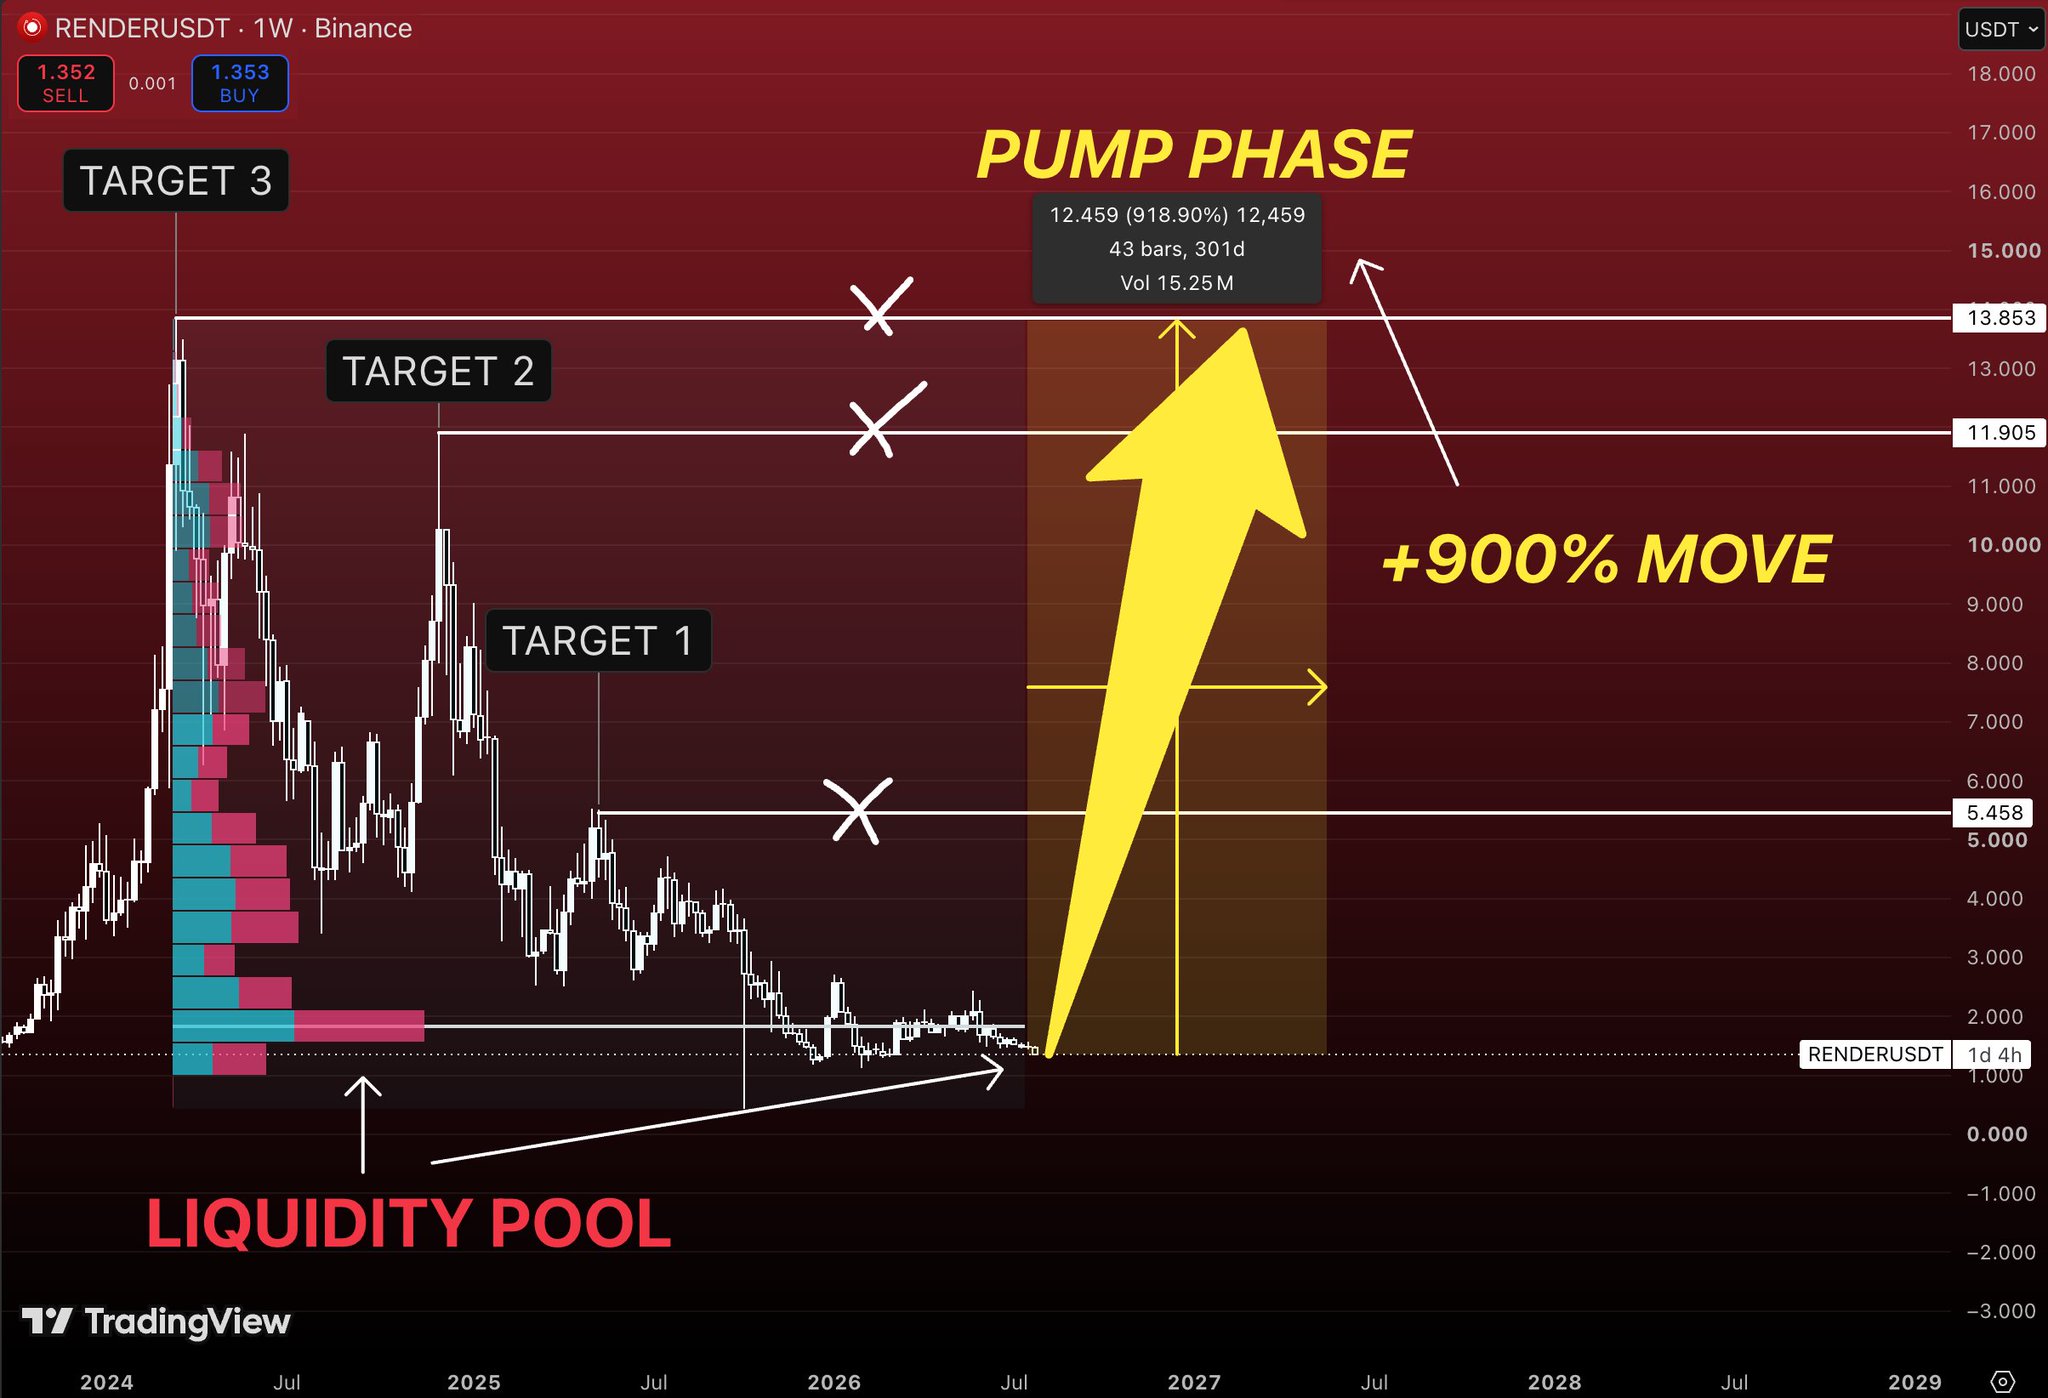
RENDER has completed its bottoming phase, expected to see a 900% rise, target price $13.8.

$RENDER has spent more than a year doing one thing.\n\nBuilding a base while everyone was chasing other narratives.\n\nMost traders see a chart that’s gone nowhere.\n\nLong-term investors see something completely different.\n\nA market that has already gone through its correction and has spent months transferring coins from impatient hands to patient ones.\n\nThat’s usually how the strongest trends begin.\n\nNot with excitement.\n\nWith boredom.\n\nOne thing immediately stands out on this chart.\n\nThe largest volume profile sits almost exactly where price is trading today.\n\nThat tells us this isn’t random consolidation.\n\nThis is where the majority of long-term positions have been built.\n\nAs long as that liquidity zone continues to hold, the bullish structure remains intact.\n\nThe first real objective sits around $5.45.\n\nIt’s the first major resistance where the previous cycle left behind significant supply.\n\nA breakout above that level would confirm that buyers have regained control of the larger trend.\n\nAbove it, the next destination becomes $11.9.\n\nThat’s where market psychology begins to shift.\n\nInvestors who ignored the move suddenly start paying attention, while those who sold near the lows begin chasing higher prices.\n\nMomentum usually accelerates once that process starts.\n\nThe final target sits near $13.8, close to the previous cycle highs.\n\nIf $RENDER manages to reclaim that area, the market enters price discovery once again.\n\nThat’s where trends often become much stronger than most people initially expect.\n\nThe interesting part isn’t the projected 900% move.\n\nIt’s the amount of time the market has spent preparing for it.\n\nBig trends rarely start after vertical rallies.\n\nThey usually start after months of silence.\n\nAfter everyone loses interest.\n\nAfter volatility disappears.\n\nThat’s exactly what this chart has been doing.\n\nIf AI narratives continue attracting capital during the next cycle\n\n$RENDER is already sitting in the kind of structure that has historically produced some of the strongest recoveries.\n\nThe hardest part isn’t buying these charts.\n\nIt’s believing in them while almost nobody else does.

view 17
view 0
view 799
2026-08-01 20:37
Tendance de RENDER après le lancement
Extrêmement haussier
RENDER has completed its bottoming phase, expected to see a 900% rise, target price $13.8.
avatar
RNDR在关键支撑位1.20美元附近盘整,作者认为当前是理想入场点,未来有望上涨。

solana:rndrizKT3MK1iimdxRdWabcF7Zg7AR5T4nud4EkHBof fell 67% from its cycle high and the crowd stopped caring.

That is exactly when the chart starts telling the truth.

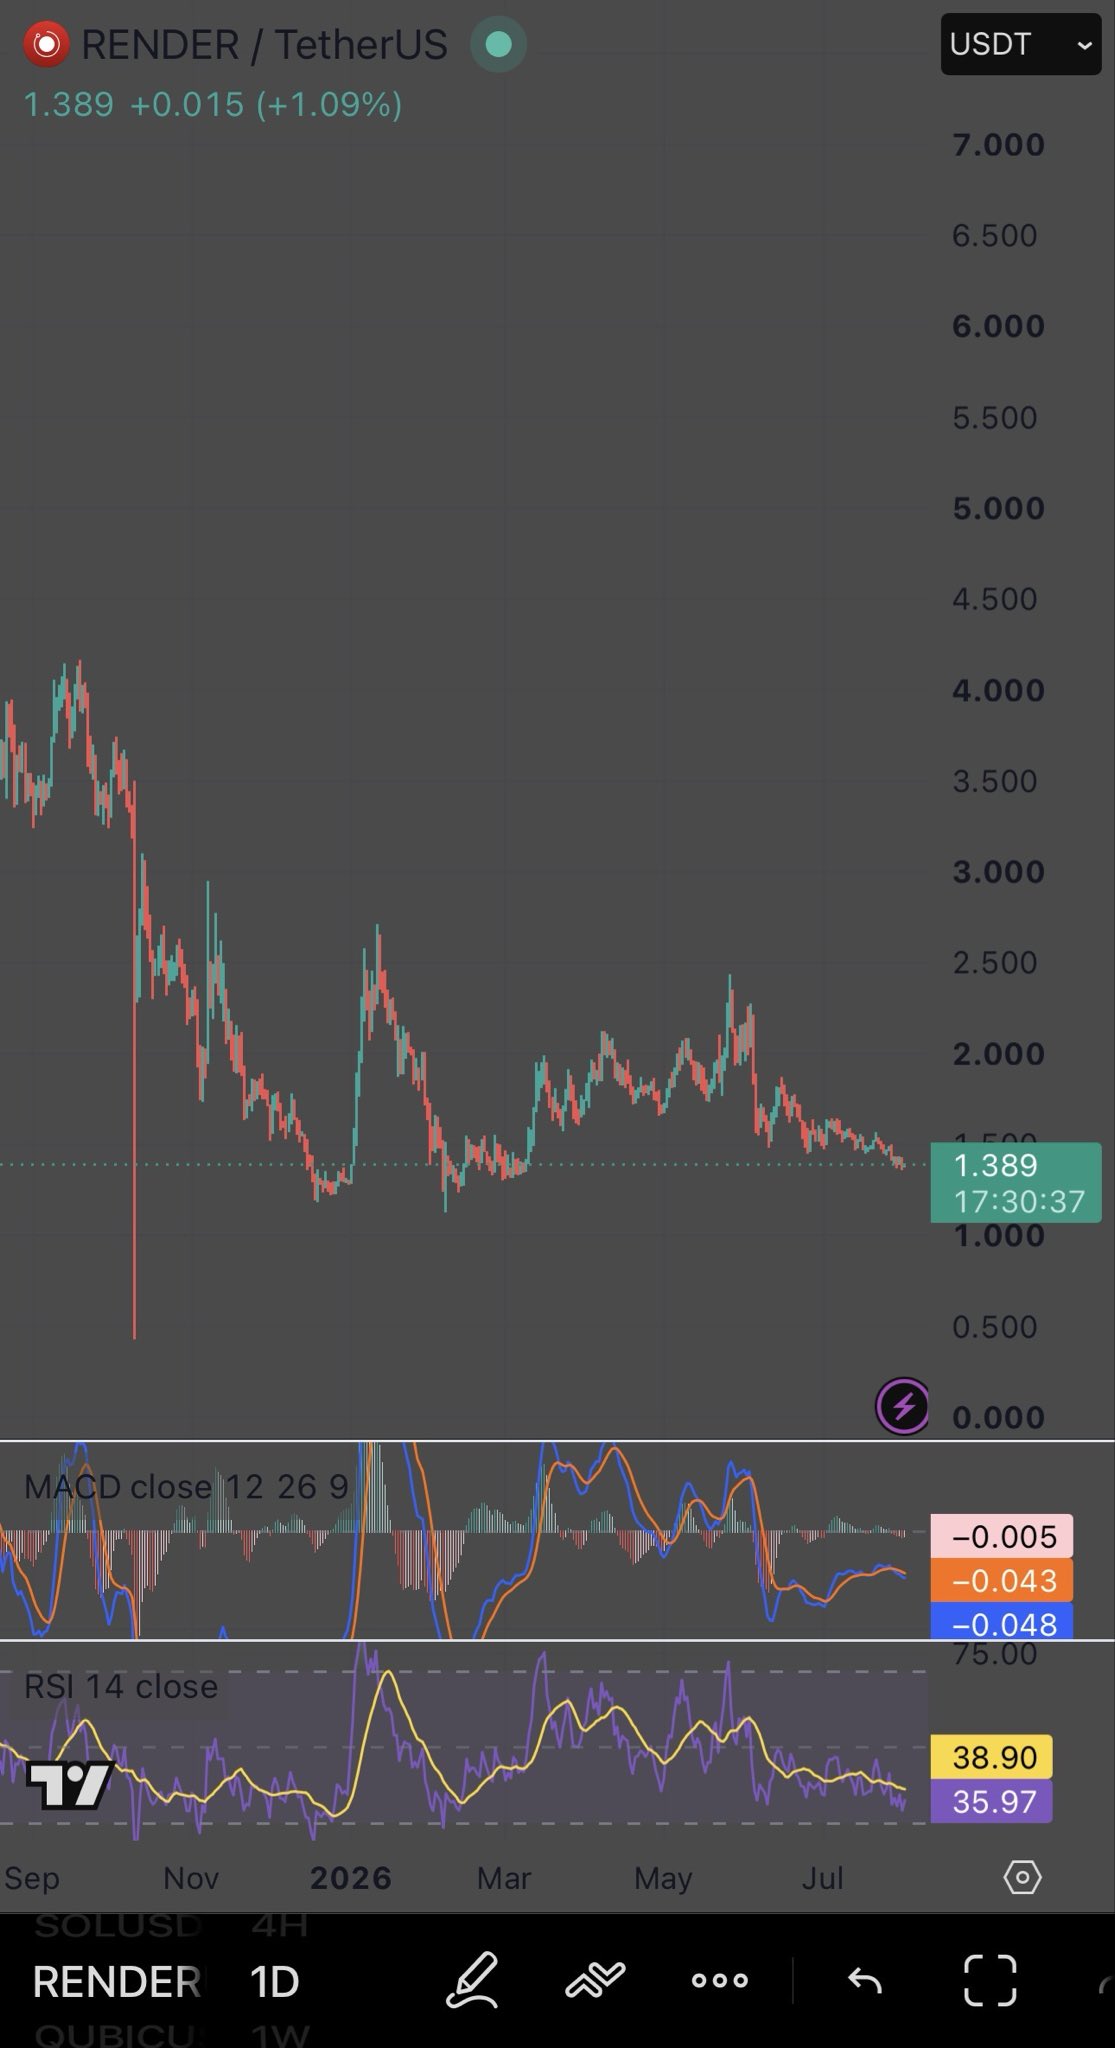
Price is back at 1.389, sitting on the same floor it defended all through last winter.

One number decides the next move:

1.20

Hold that base and this is a coiled decentralized GPU network with real rendering and AI compute demand behind it.

Lose it and the next honest support sits far below at 1.00.

Momentum is not screaming reversal yet.

RSI near 36 is weak but not oversold, and MACD is trying to curl without confirming.

That is a market catching its breath, not one turning.

Here is the part most people miss.

The best entries never feel safe.

They feel exactly like this, quiet and heavy and boring, while everyone waits for a green candle to hand them permission.

The people who mark 1.20 tonight will not need permission tomorrow.

Save this before it moves.

view 81
view 17
view 4.1K
2026-08-01 06:47
Tendance de RENDER après le lancement
Haussier
RNDR在关键支撑位1.20美元附近盘整,作者认为当前是理想入场点,未来有望上涨。
Détails

Prévision de prix

Quel est le meilleur moment pour acheter RENDER? Dois-je acheter ou vendre RENDER maintenant ?

Pour déterminer s'il est opportun d'acheter ou de vendre Render (RENDER), il est important de commencer par s'aligner sur sa propre stratégie de trading et son profil de risque. Les investisseurs à long terme et les traders à court terme interprètent souvent les conditions du marché différemment, votre décision doit donc refléter votre approche personnelle. Selon la dernière analyse technique RENDER de 4 heures, le signal de trading actuel est Tenez.
53
Tenez
Analyse technique de 4 heures de RENDER
Dernière mise à jour 2026-08-12 07:59:59
beacon

Prédiction de Beacon

Prévision probabiliste des prix (Prochaines 24 heures)
i
Avertissement de prédiction de Beacon
Les résultats affichés sur cette page sont analysés sur la base des données de trading réelles (OHLCV) de la paire de trading sélectionnée ainsi que des indicateurs techniques correspondants.
Cette prédiction est un produit technique expérimental et est fournie uniquement à titre de référence. Ceci ne constitue pas un conseil en investissement. Des événements inattendus du monde réel peuvent avoir un impact significatif sur le comportement du marché. Les traders doivent prendre des décisions avec prudence.
À propos Render
Render (RENDER) is a cryptocurrency launched in 2019and operates on the Ethereum platform. Render has a current supply of 533,532,274.56269149 with 518,772,101.28269149 in circulation. The last known price of Render is 1.29691625 USD and is down -2.28 over the last 24 hours. It is currently trading on 656 active market(s) with $13,949,045.61 traded over the last 24 hours. More information can be found at https://rendernetwork.com/.
En savoir plus
Acheter RENDER
Trader RENDER