رشد کنید
Rewards
قرعهکشی روزانه
100% Chance To Win With Daily Trades
قرعهکشی روزانه اسپات
Win 8,888 USDT In Grand Prizes
افزایش اعتبار خط همراه
افزایش اعتبار خط همراه بهراحتی، آنلاین و ایمن
Send
Send money globally, fast and secure
BitMart Mall
Live on crypto

IREN Ltd (Derivatives) (IREN)
$ 46.61 (IREN/USD)
-3.53%
24H
IREN Ltd (Derivatives) IREN تاریخچه قیمت USD
قیمت IREN Ltd (Derivatives) را برای امروز، 7 روز، 30 روز و 90 روز پیگیری کنید
دوره
تغییر
تغییر (%)
امروز
$ 1.71
-3.53%
7روزها
$ 10.73
-18.89%
30روزها
$ 8.73
-15.92%
90روزها
$ 8.73
-15.92%
تجارت IREN در سه مرحله
یک حساب کاربری رایگان ایجاد کنید، حساب خود را شارژ کنید، افزودن سپس ارز دیجیتال خود را انتخاب کنید
IREN Ltd (Derivatives) اطلاعات بازار
$ 44.36 محدوده ۲۴ ساعته $ 48.90
بالاترین رکورد زمانی
$ 63.66
همیشه پایین
$ 43.90
تغییر ۲۴ ساعته
-3.53%
حجم ۲۴ ساعت
$ 0
عرضه در گردش
0.00
IREN
مارکت کپ
$ 0
حداکثر عرضه
--
ارزش بازار کاملاً رقیقشده
$ 0
معامله IREN
کسب درآمد حتی بدون دانش مالی
Put your idle crypto to work and earn passive income through savings, staking, and more.
IREN Ltd (Derivatives) X Insight

Yimin X
Quant
FA_Analyst
B
 14.5K @yxinsights
 نزولی
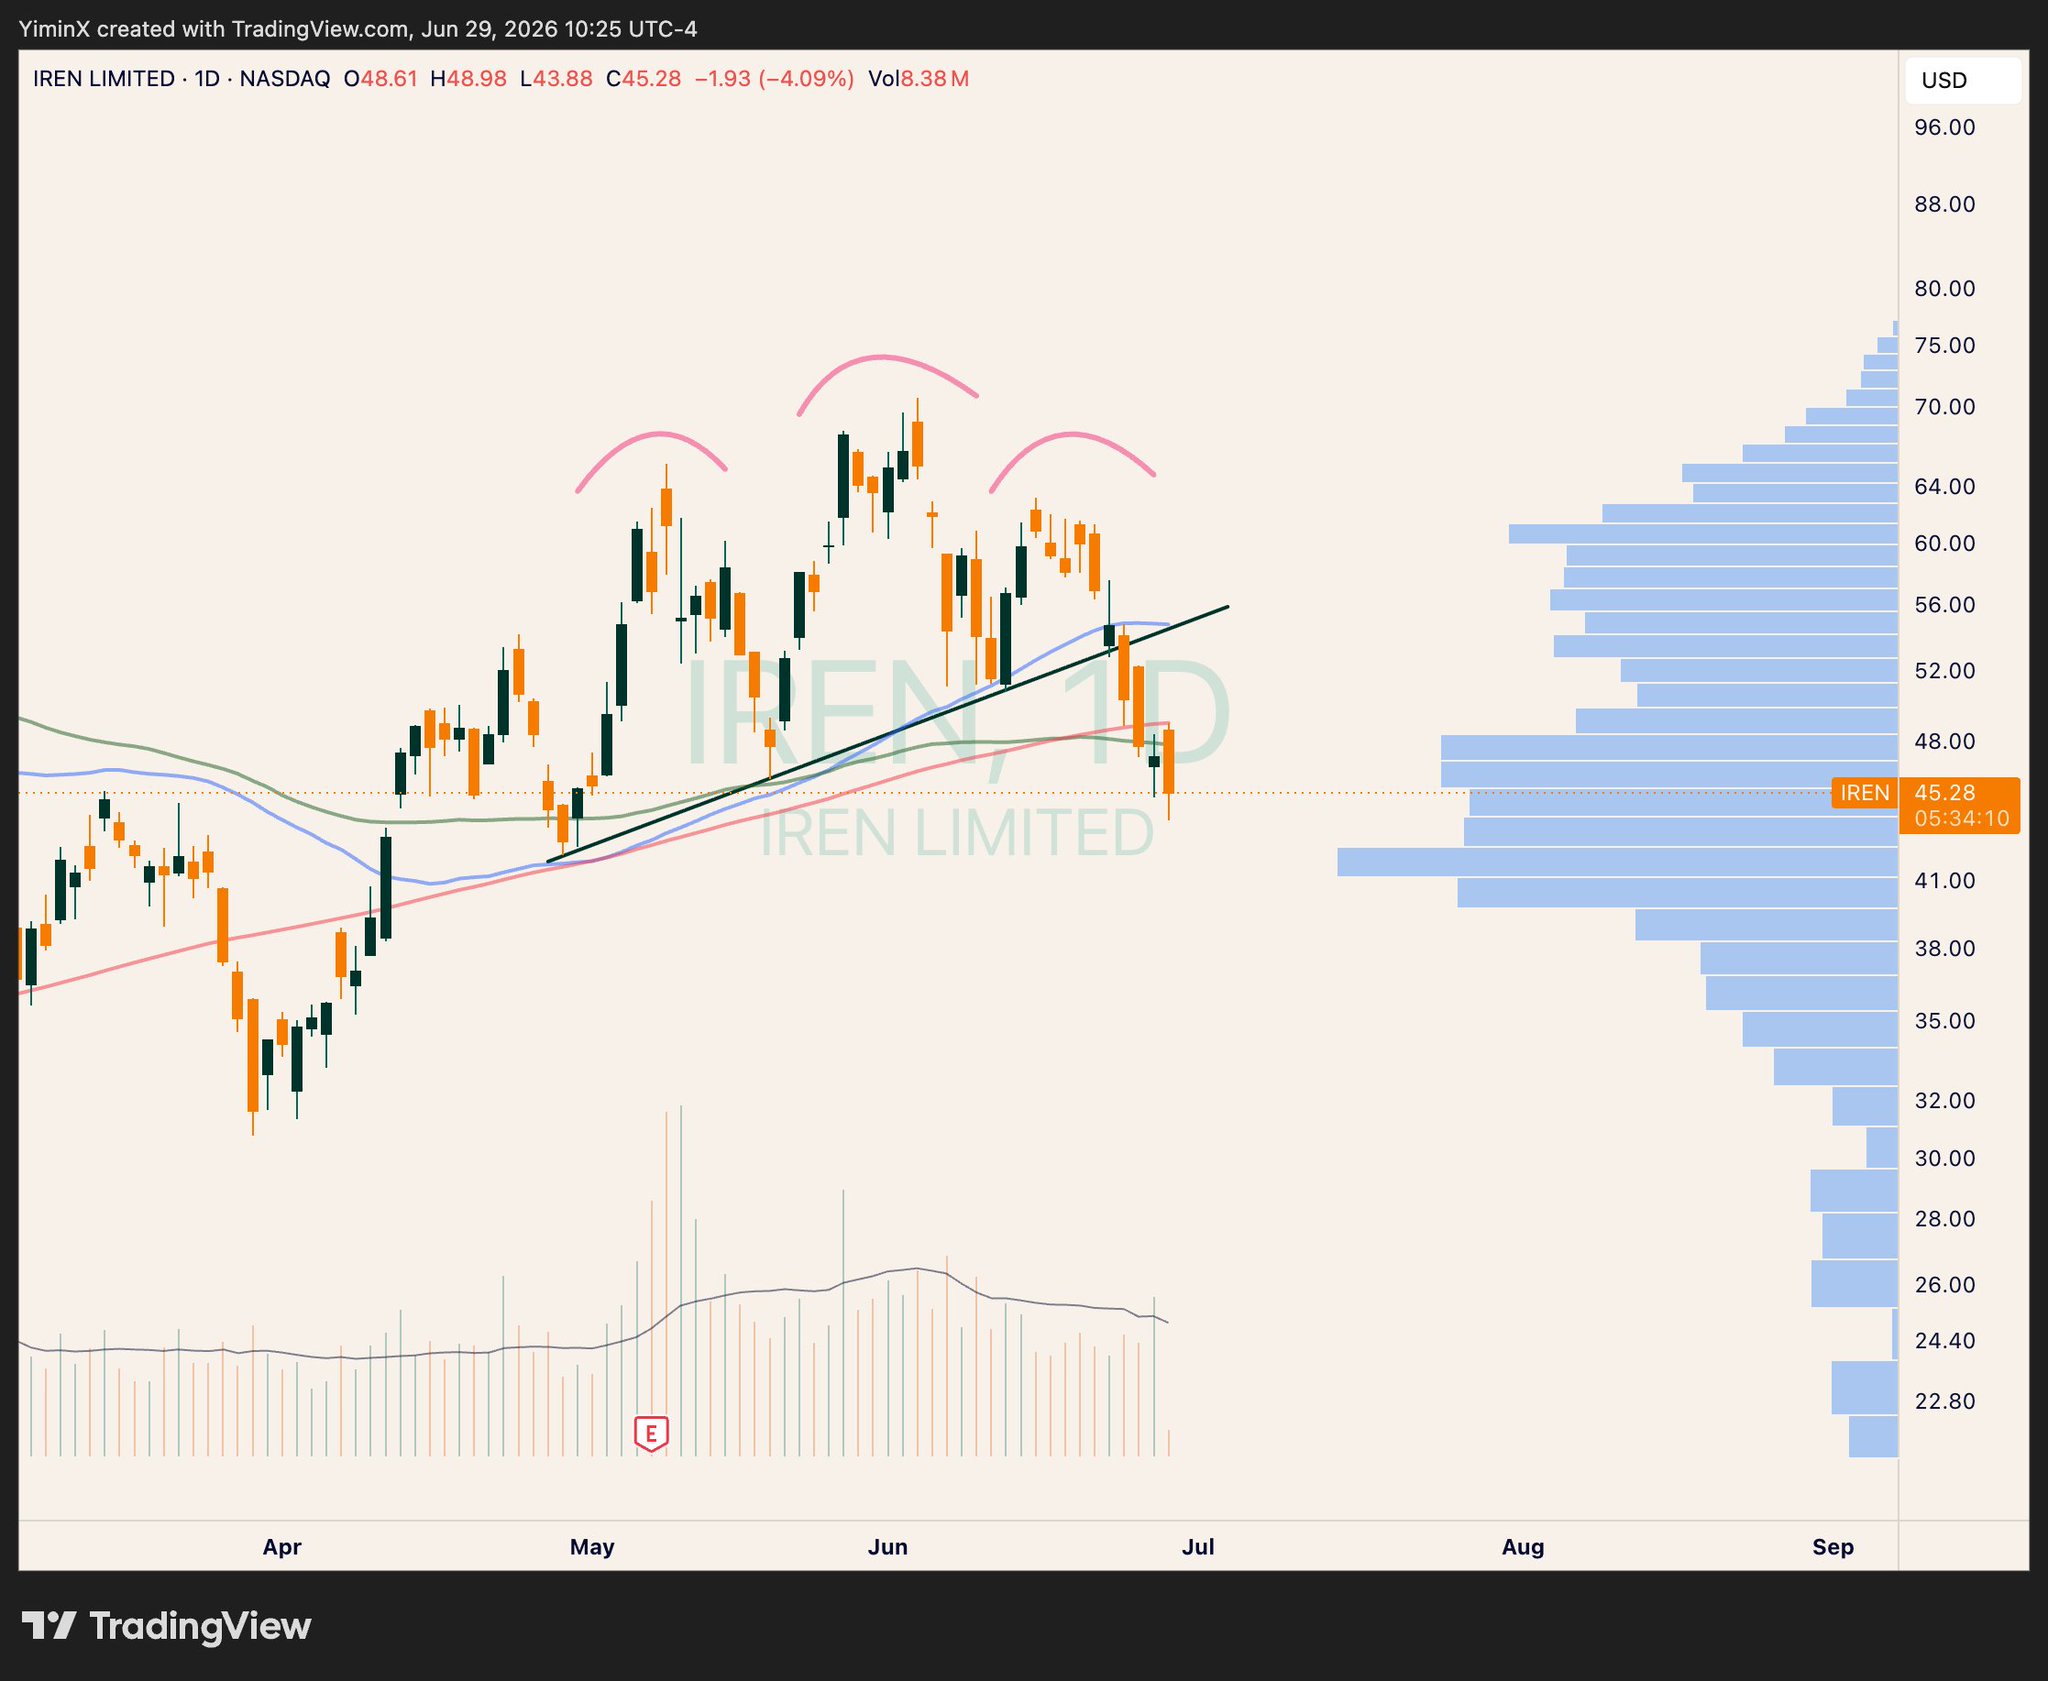
IREN broke below the 200-day moving average, the author stopped out at -18%, and the chart shows a bearish pattern.
Yimin X
Quant
FA_Analyst
B
14.5K @yxinsights Can't say I'm too happy about $IREN.
Lost the 200-day MA and couldn't reclaim it today.
Stopped out after -18% (small position sizing to tolerate the large % loss) https://t.co/tv5S4d44Zg
 16
16
 33
33
 3.8K
3.8K
2026-06-29 18:37
روند IREN پس از انتشار
بسیار نزولی
IREN broke below the 200-day moving average, the author stopped out at -18%, and the chart shows a bearish pattern.
Yimin X
Quant
FA_Analyst
B
14.5K @yxinsights نزولی
IREN broke below the 200-day moving average, the author stopped out at -18%, and the chart shows a bearish pattern.
Can't say I'm too happy about $IREN.
Lost the 200-day MA and couldn't reclaim it today.
Stopped out after -18% (small position sizing to tolerate the large % loss) https://t.co/tv5S4d44Zg
16
33
3.8K
2026-06-29 15:37
روند IREN پس از انتشار
بسیار نزولی
IREN broke below the 200-day moving average, the author stopped out at -18%, and the chart shows a bearish pattern.

🔋Chin🔋
TA_Analyst
Trader
C
4.0K @PhatChin بسیار نزولی
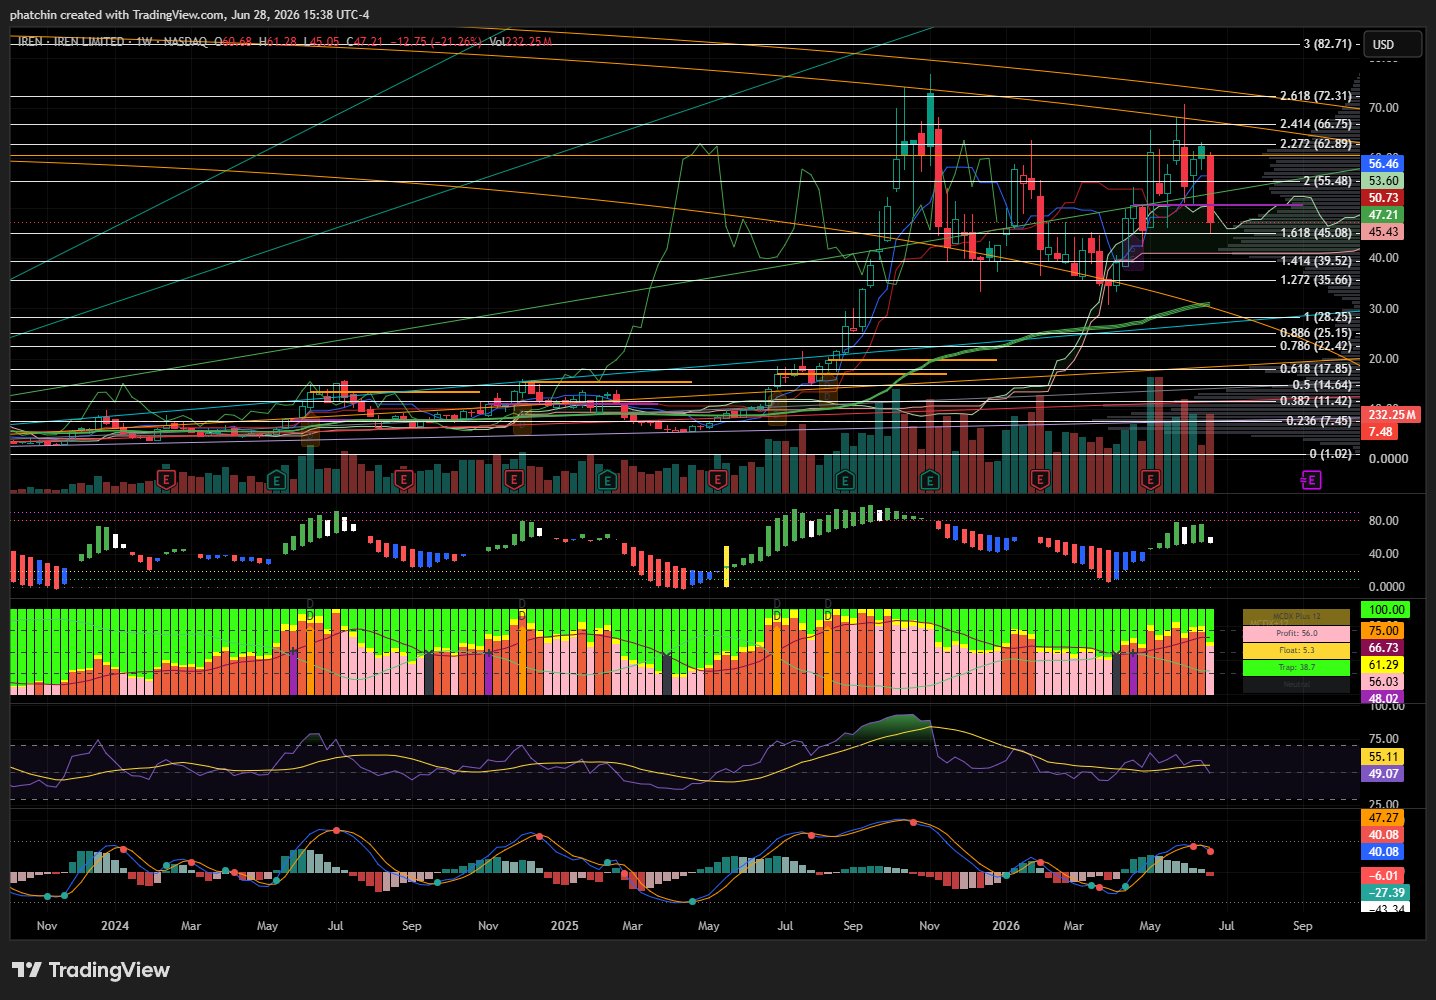
IREN retested the Fibonacci 1.618, but indicators are trending downward, MCDX is weak, short-term outlook is not optimistic.
$IREN W 🟥
Price action dutifully back-tested the 1.618 Fib and closed inside the Ichimoku cloud suggests it is ready to explore this Fib level further. Indicators curling down with MCDX going dormant pink is not a good sign. We need the 1.618 to support. https://t.co/s63krXuhC4
 7
0
564
7
0
564
2026-06-28 19:57
روند IREN پس از انتشار
نزولی
IREN retested the Fibonacci 1.618, but indicators are trending downward, MCDX is weak, short-term outlook is not optimistic.
پیشبینی قیمت
چه زمانی برای خرید IREN مناسب است؟ آیا اکنون باید IREN بخرم یا بفروشم؟
از دیدگاه تجزیه و تحلیل فنی بر اساس تحلیل تکنیکال 4 ساعته IREN، سیگنال معاملاتی نگهداری است.

پیشبینی Beacon
پیشبینی احتمالی قیمت (24 ساعت آینده)اطلاعیه
بازارهای پیشبینی ذاتاً نوسانپذیر هستند. قیمت واقعی تراکنش ممکن است با قیمت نمایش دادهشده متفاوت باشد و پرداخت نهایی طبق قوانین تسویه پلتفرم تعیین میشود.
درباره IREN Ltd (Derivatives)
IREN Ltd (Derivatives) (IREN) is a cryptocurrency . IREN Ltd (Derivatives) has a current supply of 0. The last known price of IREN Ltd (Derivatives) is 47.47211414 USD and is down -0.80 over the last 24 hours. It is currently trading on 30 active market(s) with $0.00 traded over the last 24 hours.
بیشتر بخوانید
کاوش بیشتر
کشف BM


لیستینگ جدید

APLDON Applied Digital
-- 0.00%

NEEON NextEra Energy
-- 0.00%

ONON ON Semiconductor Corporation
-- 0.00%

SCHWON The Charles Schwab Corporation
-- 0.00%

ANSEM The Black Bull
-- 0.00%

CIFRON Cipher Mining Inc.
-- 0.00%

WULFON TeraWulf Inc.
-- 0.00%

PINSON Pinterest, Inc.
-- 0.00%

HPEON Hewlett Packard Enterprise Co
-- 0.00%

PCGON PG&E
-- 0.00%