
📺 Ubisoft shuts Champions Tactics Oct 30 as WEMIX loses $724K to exploit
Learn more about:
Full breakdown 👇
➡️ Watch Video: https://t.co/85N6fwxxcI
Comprar cripto
tarjeta
Comercio P2P
Compra USDT en un marketplace
Tarjeta de crédito/débito
Compre criptomonedas con Visa o MasterCard
Pago vía prestadores
Compre criptomonedas a través de MoonPay, Simplex y más
Tarjeta BitMart
Impulsando su experiencia con las criptomonedas
Tarjeta prepago de criptomonedas
Obtenga una Mastercard lista para usar al instante
Comerciar
USDⓈ-M
Utilizando USDⓈ como colateral
COIN-M
Utilizando la propia moneda como colateral
TradFi
Trading integral para metales, acciones y forex
Operativa de demostración
Aprenda a operar con riesgo cero
Resumen de futuros
Plataforma única para todo lo relacionado con futuros
Rey de Futuros
Pool de premios de 478 000 USDT
Crecer
Resumen de Earn
Activos inactivos, gane con facilidad
Ahorros
Gane intereses conservando su portafolio.
Staking
Staking sencillo, cuantiosas retribuciones.
Gestión de patrimonio
Aumente su riqueza con un equipo de activos top
RWA
Mantenga BMRUSD, disfrute del rendimiento
Exclusivo VIP
Gane de forma estable para usuarios VIP
Rewards
Centro de recompensas
Descubra recompensas exclusivas por valor de hasta 14 000 USDT
LaunchPrime
Una plataforma para lanzar tokens y NFT
Programa de afiliados
Únase para ganar cuantiosas comisiones
Powerdrop
¡La solución AirDrop de próxima generación ya está AQUÍ!
Centro de eventos
El centro unificado para todas las operaciones de trading
Sorteo diario de futuros
100 % de probabilidades de ganar con operaciones diarias
Sorteo diario de Spot
Gane 8888 USDT en grandes premios
Recarga móvil
Recargue móviles de forma fácil, online y segura
Send
Send money globally, fast and secure
BitMart Mall
Viva de las criptomonedas
WEMIX Datos de precios en tiempo real
El precio de hoy de WEMIX es de $ 0.19 (WEMIX/USD). Con una capitalización de mercado de $ 99.85M USD. Volumen de trading en 24 horas de $ 486.32K USD, Un cambio de precio en 24 horas de +0.00%. Y un suministro circulante de 499.36M WEMIX.
WEMIX WEMIX Historial de precios USD
Siga el precio de WEMIX para hoy, 7 días, 30 días y 90 días
Periodo
Cambiar
Cambio (%)
Hoy
$ 0
0.00%
7días
--
--
30días
--
--
90días
--
--
Sea propietario de WEMIX ahora
Compra y vende WEMIX fácil y seguro en BitMart.
WEMIX Información de mercado
$ 0.19 Autonomía de 24 horas $ 0.19
Máximo histórico
$ 0
El mínimo histórico
$ 0
Cambio en 24 h
0.00%
Volumen en 24 h
$ 486,316.30
Suministros en circulación
499.36M
WEMIX
Market Cap
$ 99.85M
Suministro máximo
0.59B
WEMIX
Capitalización de mercado totalmente diluida
$ 117.98M
Trade WEMIX
Ganar
Pon a trabajar tus criptomonedas inactivas y obtén ingresos pasivos a través de ahorros, staking y más.
WEMIX X Insight

PlayToEarn
OnChain_Analyst
Media
B
 83.6K @PlayToEarn
 Extremadamente bajista
WEMIX因漏洞损失724K美元,短期看空
 24
24
 7
7
 8.6K
8.6K
2026-07-31 12:57
Tendencia de WEMIX tras el lanzamiento
Bajista
WEMIX因漏洞损失724K美元,短期看空

Kurnia Bijaksana
TA_Analyst
Educator
C
47.3K @mkbijaksana Extremadamente alcista
The tweet shares an altcoin trading strategy that identifies and follows rising trends when BTC dominance is falling and altcoins are bullish.
Pro tip: If the market is in a condition where
- BTC dominance is falling
- TOTAL2 shows a bullish signal
- Large altcoins are above the 21 EMA on the 1-day timeframe
Check the method below
Kurnia Bijaksana
TA_Analyst
Educator
C
47.3K @mkbijaksana DAILY CRYPTO TRADING TUTORIAL: FOLLOW THE TREND (BULLISH)
This method utilizes the follow‑the‑trend principle.
My principle: What goes up will keep going up until a reversal sign appears.
Therefore, we take advantage of assets that are gaining momentum and try to follow their upward move.
Step 1: Market Screening.
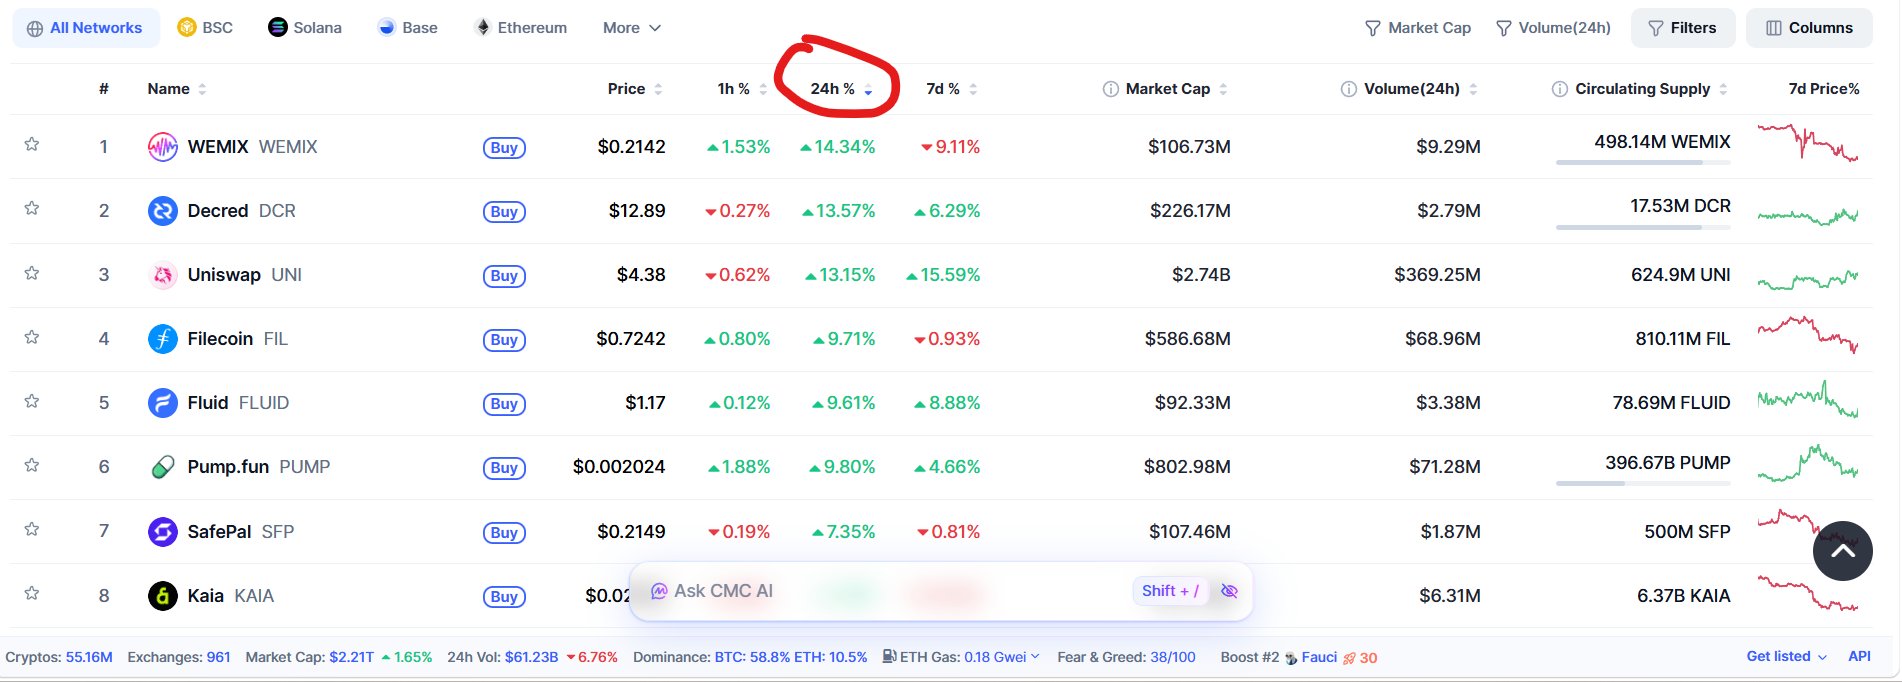
Go to CoinMarketCap, or your favorite exchange. Sort by 24H% or top gainers. You can click the 24H% or %Gains column depending on the exchange, until it lists the highest (see image 1). The example image shows WEMIX, DCR, UNI, among others.
Step 2: Ensure a bullish bias.
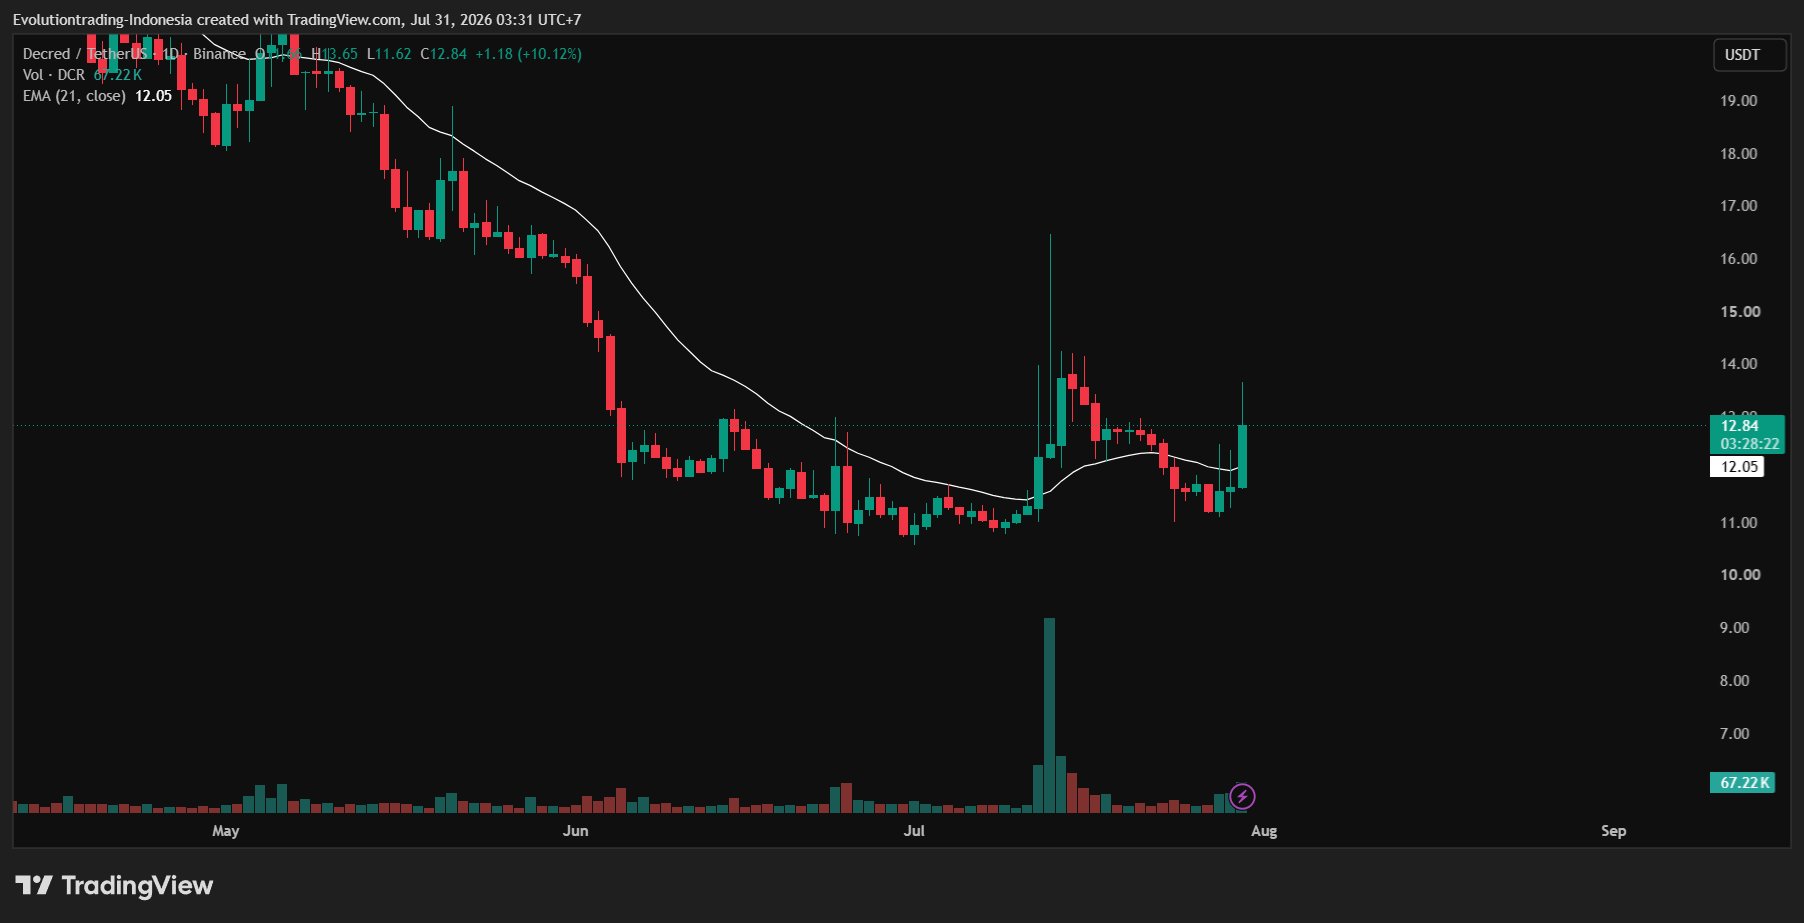
Open TradingView (or the exchange you use, on its chart). Switch to the 1‑day timeframe first. Make sure:
- The chart is bullish (green) and
- Not too high. Avoid charts that look like tall pillars on the 1‑day timeframe; they are usually too late.
(See example in image 2)
You can look at several charts, mark those meeting the criteria, then proceed to step 3.
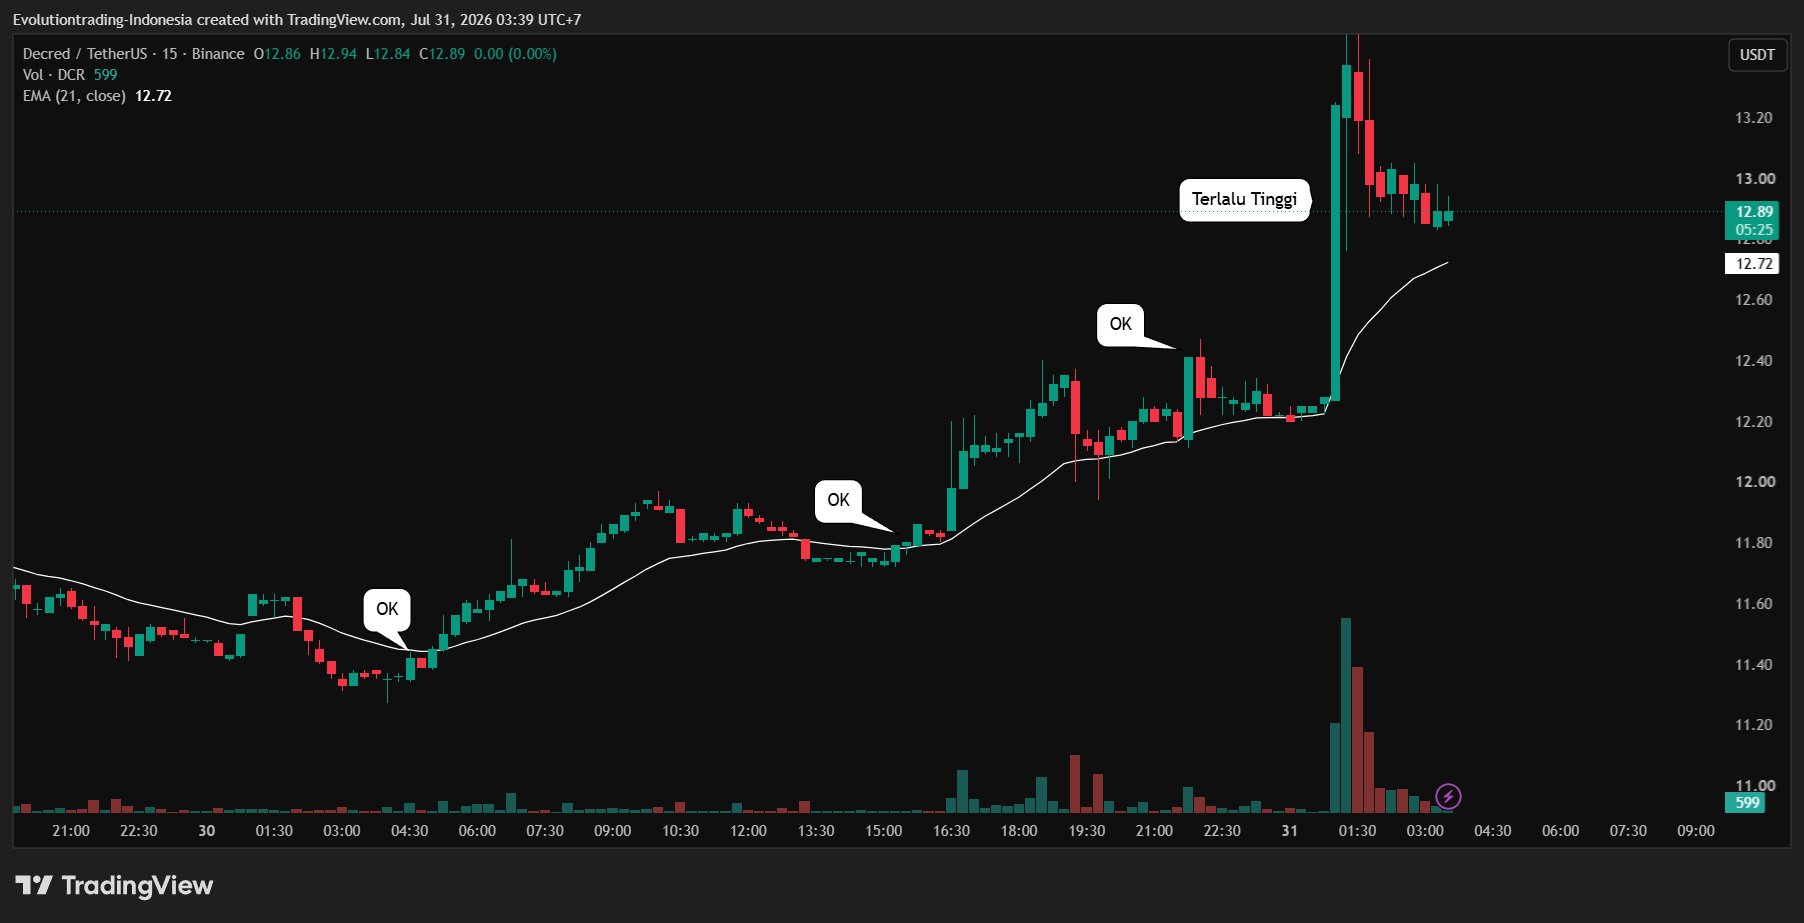
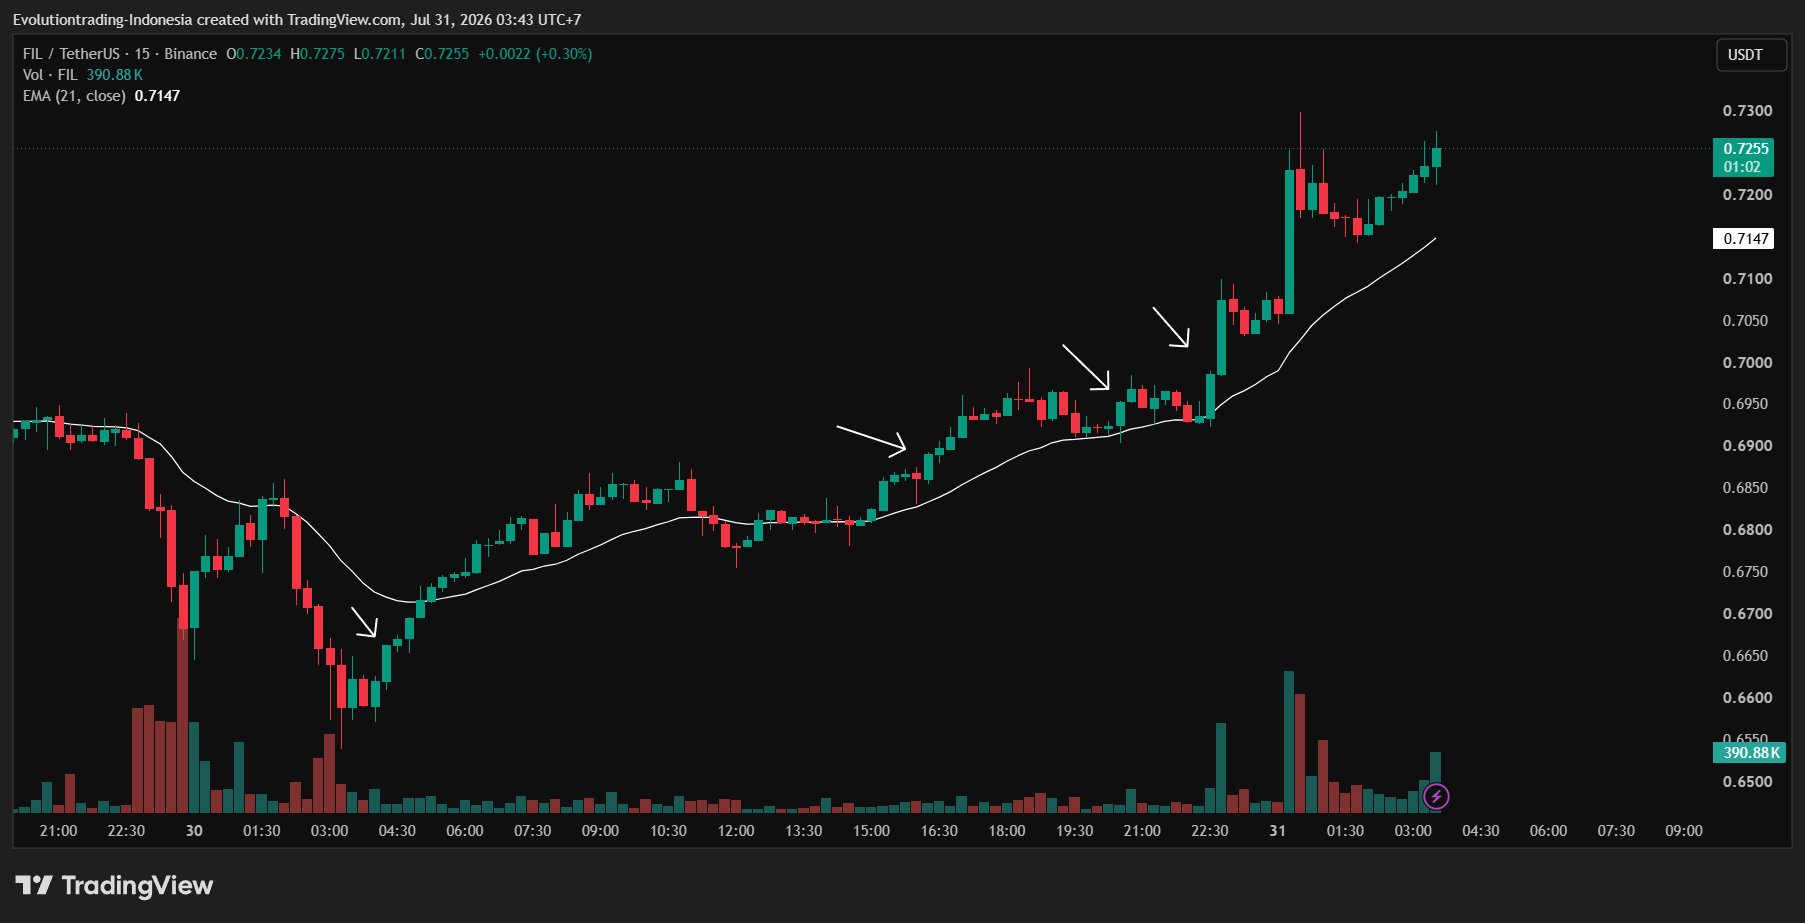
Step 3: Entry Trigger
There are many ways, I will discuss them later.
 21
0
2.3K
21
0
2.3K
2026-07-31 04:57
Tendencia de WEMIX tras el lanzamiento
Extremadamente alcista
The tweet shares an altcoin trading strategy that identifies and follows rising trends when BTC dominance is falling and altcoins are bullish.
Kurnia Bijaksana
TA_Analyst
Educator
C
47.3K @mkbijaksana Alcista
The tweet shares an altcoin trading strategy that identifies and follows rising trends when BTC dominance is falling and altcoins are bullish.
DAILY CRYPTO TRADING TUTORIAL: FOLLOW THE TREND (BULLISH)
This method utilizes the follow‑the‑trend principle.
My principle: What goes up will keep going up until a reversal sign appears.
Therefore, we take advantage of assets that are gaining momentum and try to follow their upward move.
Step 1: Market Screening.
Go to CoinMarketCap, or your favorite exchange. Sort by 24H% or top gainers. You can click the 24H% or %Gains column depending on the exchange, until it lists the highest (see image 1). The example image shows WEMIX, DCR, UNI, among others.
Step 2: Ensure a bullish bias.
Open TradingView (or the exchange you use, on its chart). Switch to the 1‑day timeframe first. Make sure:
- The chart is bullish (green) and
- Not too high. Avoid charts that look like tall pillars on the 1‑day timeframe; they are usually too late.
(See example in image 2)
You can look at several charts, mark those meeting the criteria, then proceed to step 3.
Step 3: Entry Trigger
There are many ways, I will discuss them later.
190
6
32.6K
2026-07-31 03:17
Tendencia de WEMIX tras el lanzamiento
Alcista
The tweet shares an altcoin trading strategy that identifies and follows rising trends when BTC dominance is falling and altcoins are bullish.
Predicción de precios
¿Cuándo es un buen momento para comprar WEMIX? ¿Debería comprar o vender WEMIX ahora?
Al decidir si es un buen momento para comprar o vender WEMIX (WEMIX), es importante ajustarse primero a su propia estrategia de trading y perfil de riesgo. Los inversores a largo plazo y los traders a corto plazo suelen interpretar las condiciones del mercado de forma diferente, por lo que su decisión debe reflejar su enfoque personal. Según el último análisis técnico de 4 horas de WEMIX, la señal de trading actual es Hold.

Predicción de Beacon
Pronóstico probabilístico de precios (próximas 24 horas)Descargo de responsabilidad de la predicción de Beacon
Los resultados de los datos que se muestran en esta página se analizan en función de los datos de trading reales (OHLCV) del par de trading seleccionado junto con los indicadores técnicos correspondientes.
Esta predicción es un producto técnico experimental y se proporciona solo con fines de referencia. No constituye un consejo de inversión. Los acontecimientos inesperados del mundo real pueden influir significativamente en el comportamiento del mercado. Por tanto, los traders deben tomar decisiones con precaución.
Esta predicción es un producto técnico experimental y se proporciona solo con fines de referencia. No constituye un consejo de inversión. Los acontecimientos inesperados del mundo real pueden influir significativamente en el comportamiento del mercado. Por tanto, los traders deben tomar decisiones con precaución.
Sobre WEMIX
WEMIX (WEMIX) is a cryptocurrency launched in 2020. WEMIX has a current supply of 560,158,782.4927065 with 499,361,870.28307045 in circulation. The last known price of WEMIX is 0.19399076 USD and is up 1.22 over the last 24 hours. It is currently trading on 65 active market(s) with $346,636.25 traded over the last 24 hours. More information can be found at http://wemix.com/.
Leer más
Enlaces oficiales
Explorador de blockchain
Comprar WEMIX
Trade WEMIX