Empezar
Escanee para descargar la aplicación
para iOS y Android

Render (RENDER)

$
$ 1.28 (RENDER/USD)
2.40%
24H

Render Datos de precios en tiempo real

El precio de hoy de Render es de $ 1.28 (RENDER/USD). Con una capitalización de mercado de $ 663.40M USD. Volumen de trading en 24 horas de $ 16.42M USD, Un cambio de precio en 24 horas de +2.40%. Y un suministro circulante de 518.77M RENDER.

Render RENDER Historial de precios USD

Siga el precio de Render para hoy, 7 días, 30 días y 90 días
Periodo
Cambiar
Cambio (%)
Hoy
$ 0.029
2.40%
7días
--
--
30días
--
--
90días
--
--

Sea propietario de RENDER ahora

Compra y vende RENDER fácil y seguro en BitMart.
Comprar/Vender RENDER ahora
Comprar/Vender {0} ahora
Render Información de mercado
Último precio $ 1.28
$ 1.24 Autonomía de 24 horas $ 1.28
Máximo histórico
‎$ 0‎
El mínimo histórico
‎$ 0‎
Cambio en 24 h
‎2.40%‎
Volumen en 24 h
‎$ 16,419,399.16‎
Suministros en circulación
0.51B RENDER
Market Cap
‎$ 663.40M‎
Suministro máximo
0.64B RENDER
Capitalización de mercado totalmente diluida
‎$ 823.76M‎
Trade RENDER

Ganar

Pon a trabajar tus criptomonedas inactivas y obtén ingresos pasivos a través de ahorros, staking y más.
Pruébelo ahora
Pruébelo ahora

Render X Insight

avatar
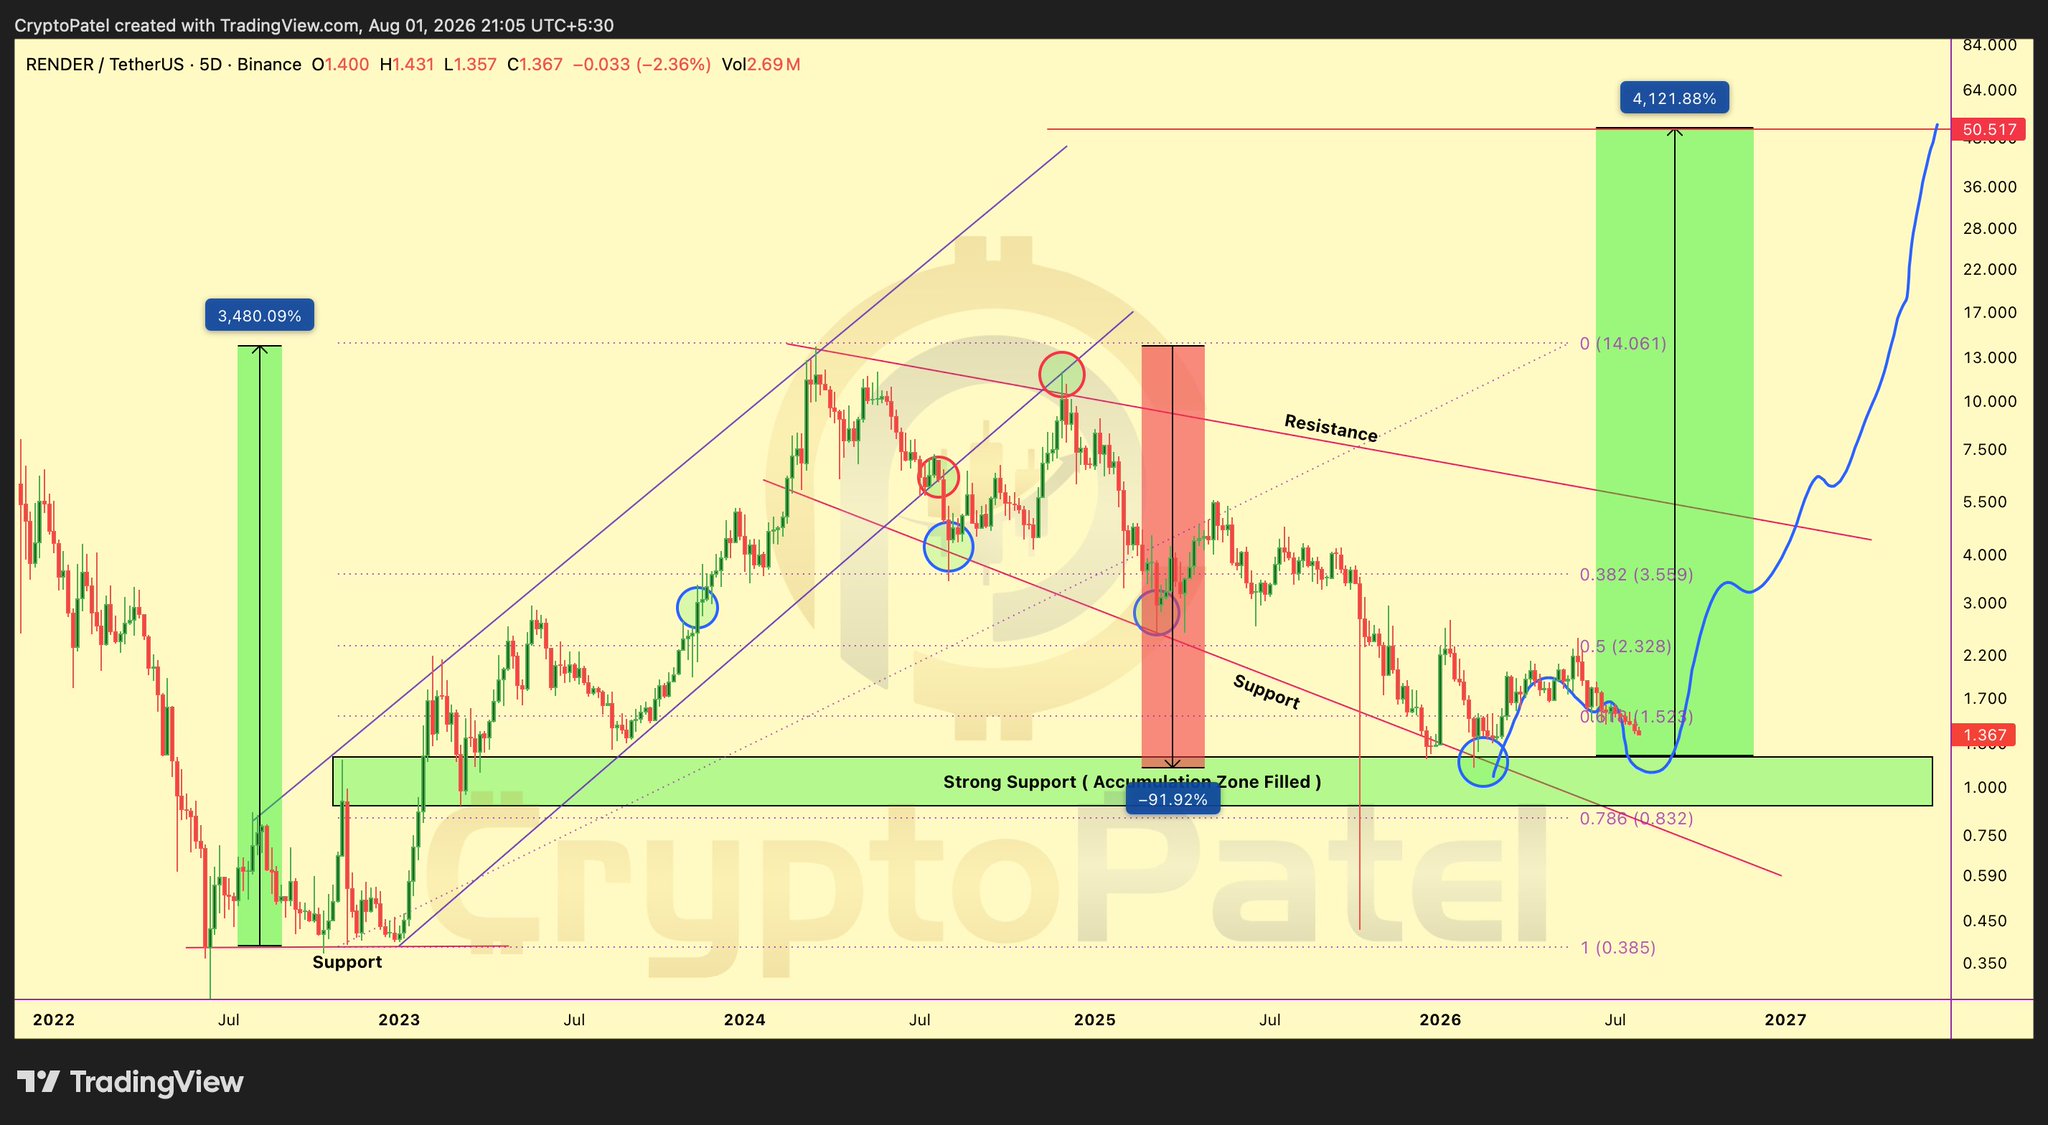
RENDER is in an accumulation zone, with limited downside and huge upside potential, target price $10-$50.

$RENDER is back in the same HTF Accumulation zone that fueled its previous parabolic rally

After a 92%+ correction, downside looks increasingly limited while the upside remains massive. If this support holds, the next major move could catch most people completely off guard. 🚀

Accumulation Zone: $1.35-$0.90
Targets: $10 | $20 | $30 | $50
Stop Loss: HTF Close Below $0.70

NFA & Always DYOR

@render
view 282
view 23
view 31.2K
2026-08-02 05:37
Tendencia de RENDER tras el lanzamiento
Extremadamente alcista
RENDER is in an accumulation zone, with limited downside and huge upside potential, target price $10-$50.
avatar
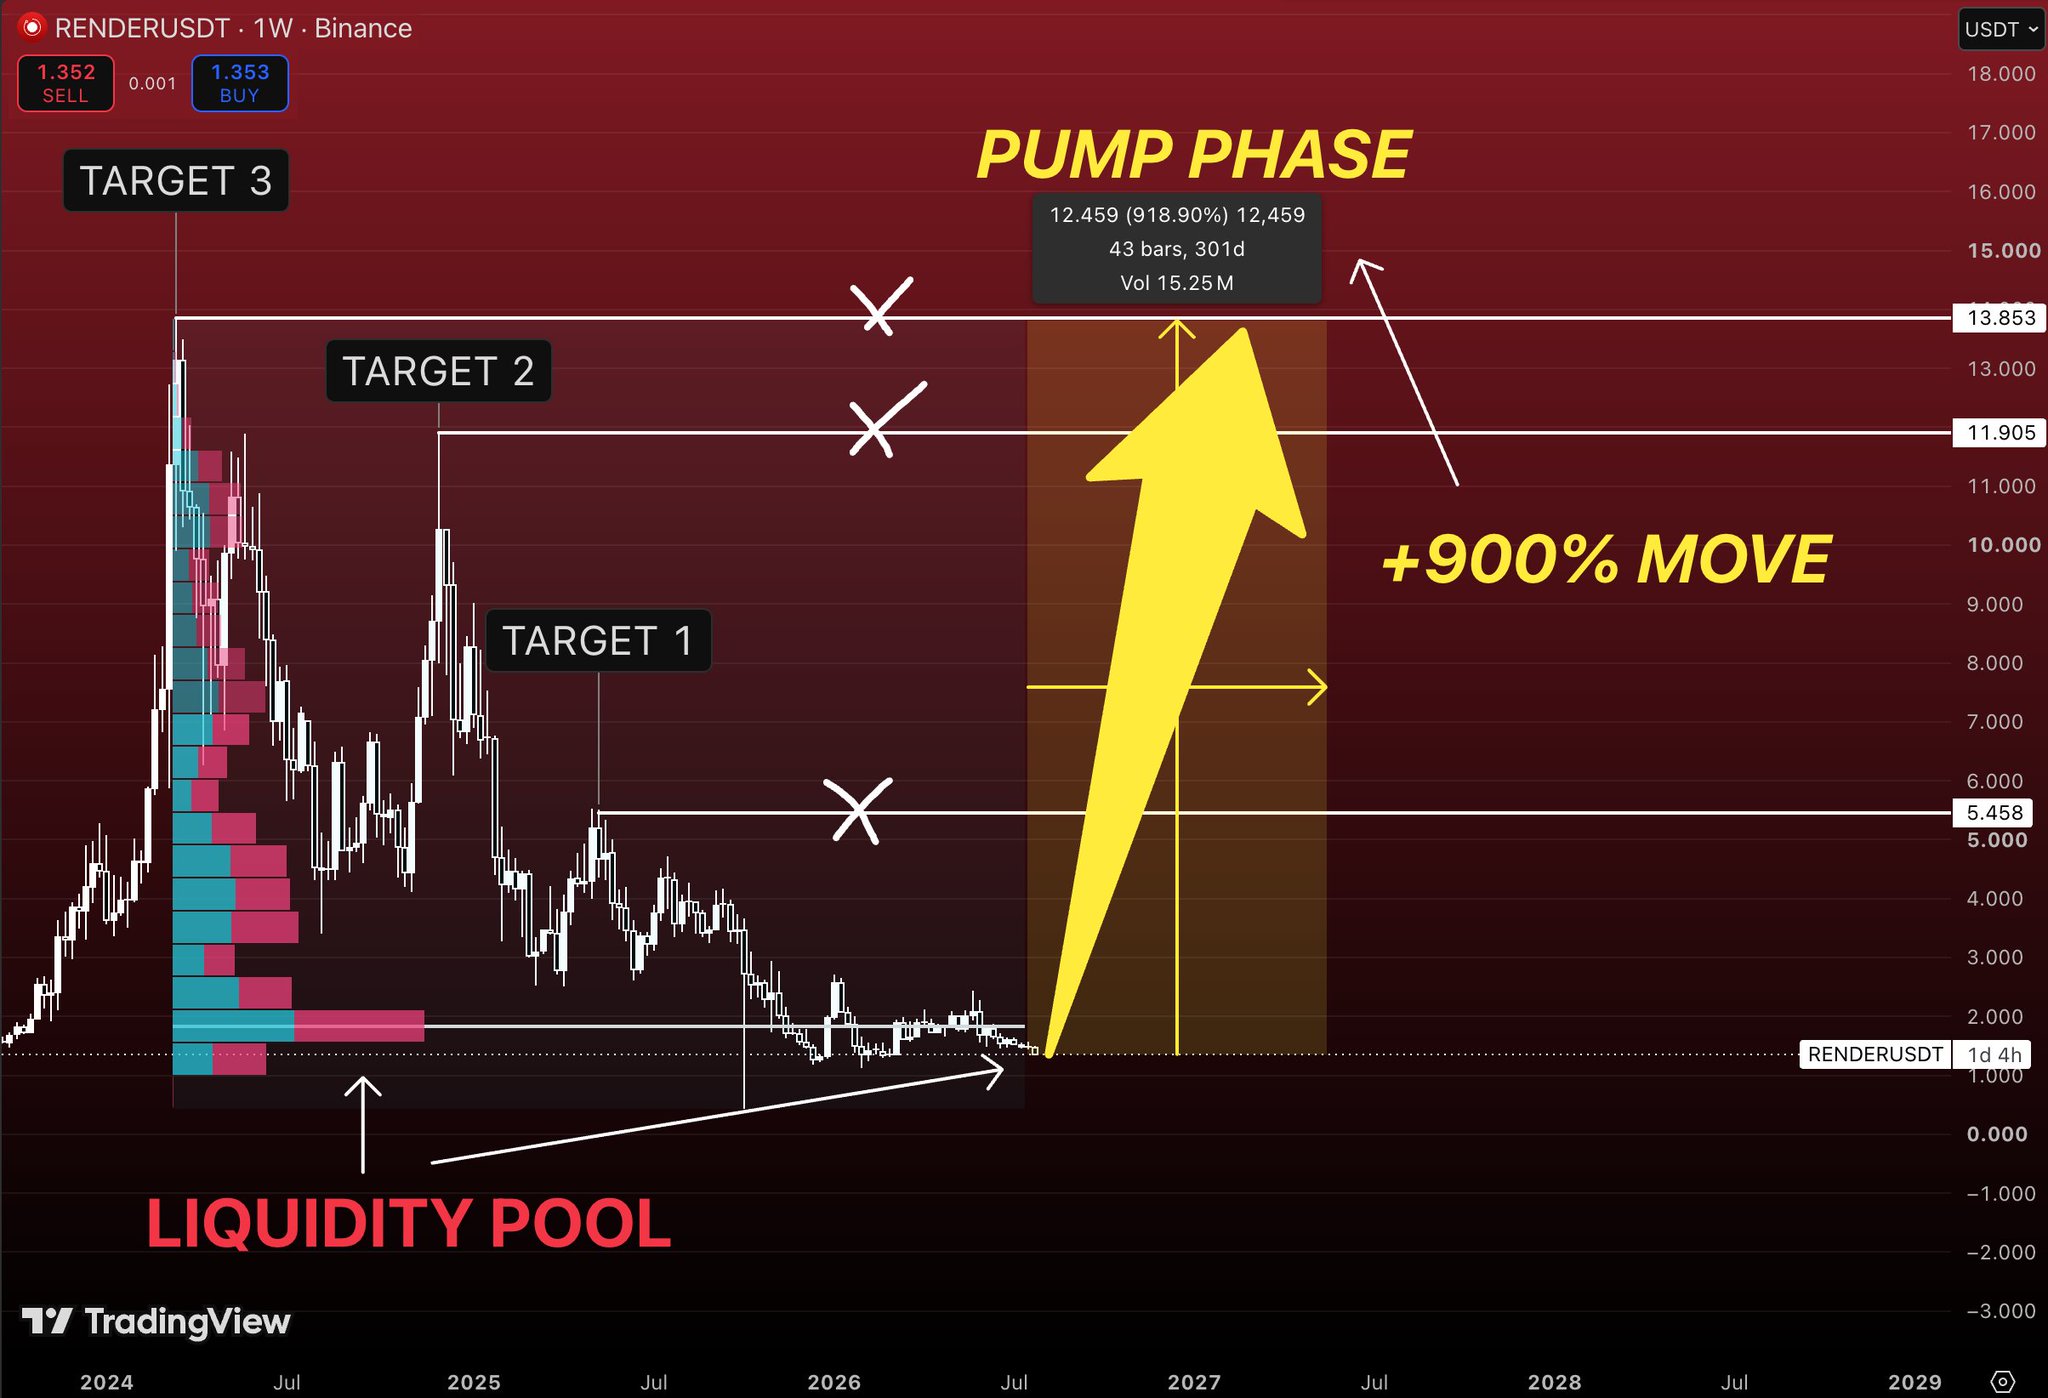
RENDER has completed its bottoming phase, expected to see a 900% rise, target price $13.8.

$RENDER has spent more than a year doing one thing.\n\nBuilding a base while everyone was chasing other narratives.\n\nMost traders see a chart that’s gone nowhere.\n\nLong-term investors see something completely different.\n\nA market that has already gone through its correction and has spent months transferring coins from impatient hands to patient ones.\n\nThat’s usually how the strongest trends begin.\n\nNot with excitement.\n\nWith boredom.\n\nOne thing immediately stands out on this chart.\n\nThe largest volume profile sits almost exactly where price is trading today.\n\nThat tells us this isn’t random consolidation.\n\nThis is where the majority of long-term positions have been built.\n\nAs long as that liquidity zone continues to hold, the bullish structure remains intact.\n\nThe first real objective sits around $5.45.\n\nIt’s the first major resistance where the previous cycle left behind significant supply.\n\nA breakout above that level would confirm that buyers have regained control of the larger trend.\n\nAbove it, the next destination becomes $11.9.\n\nThat’s where market psychology begins to shift.\n\nInvestors who ignored the move suddenly start paying attention, while those who sold near the lows begin chasing higher prices.\n\nMomentum usually accelerates once that process starts.\n\nThe final target sits near $13.8, close to the previous cycle highs.\n\nIf $RENDER manages to reclaim that area, the market enters price discovery once again.\n\nThat’s where trends often become much stronger than most people initially expect.\n\nThe interesting part isn’t the projected 900% move.\n\nIt’s the amount of time the market has spent preparing for it.\n\nBig trends rarely start after vertical rallies.\n\nThey usually start after months of silence.\n\nAfter everyone loses interest.\n\nAfter volatility disappears.\n\nThat’s exactly what this chart has been doing.\n\nIf AI narratives continue attracting capital during the next cycle\n\n$RENDER is already sitting in the kind of structure that has historically produced some of the strongest recoveries.\n\nThe hardest part isn’t buying these charts.\n\nIt’s believing in them while almost nobody else does.

view 17
view 0
view 799
2026-08-01 20:37
Tendencia de RENDER tras el lanzamiento
Extremadamente alcista
RENDER has completed its bottoming phase, expected to see a 900% rise, target price $13.8.
avatar
RNDR在关键支撑位1.20美元附近盘整,作者认为当前是理想入场点,未来有望上涨。

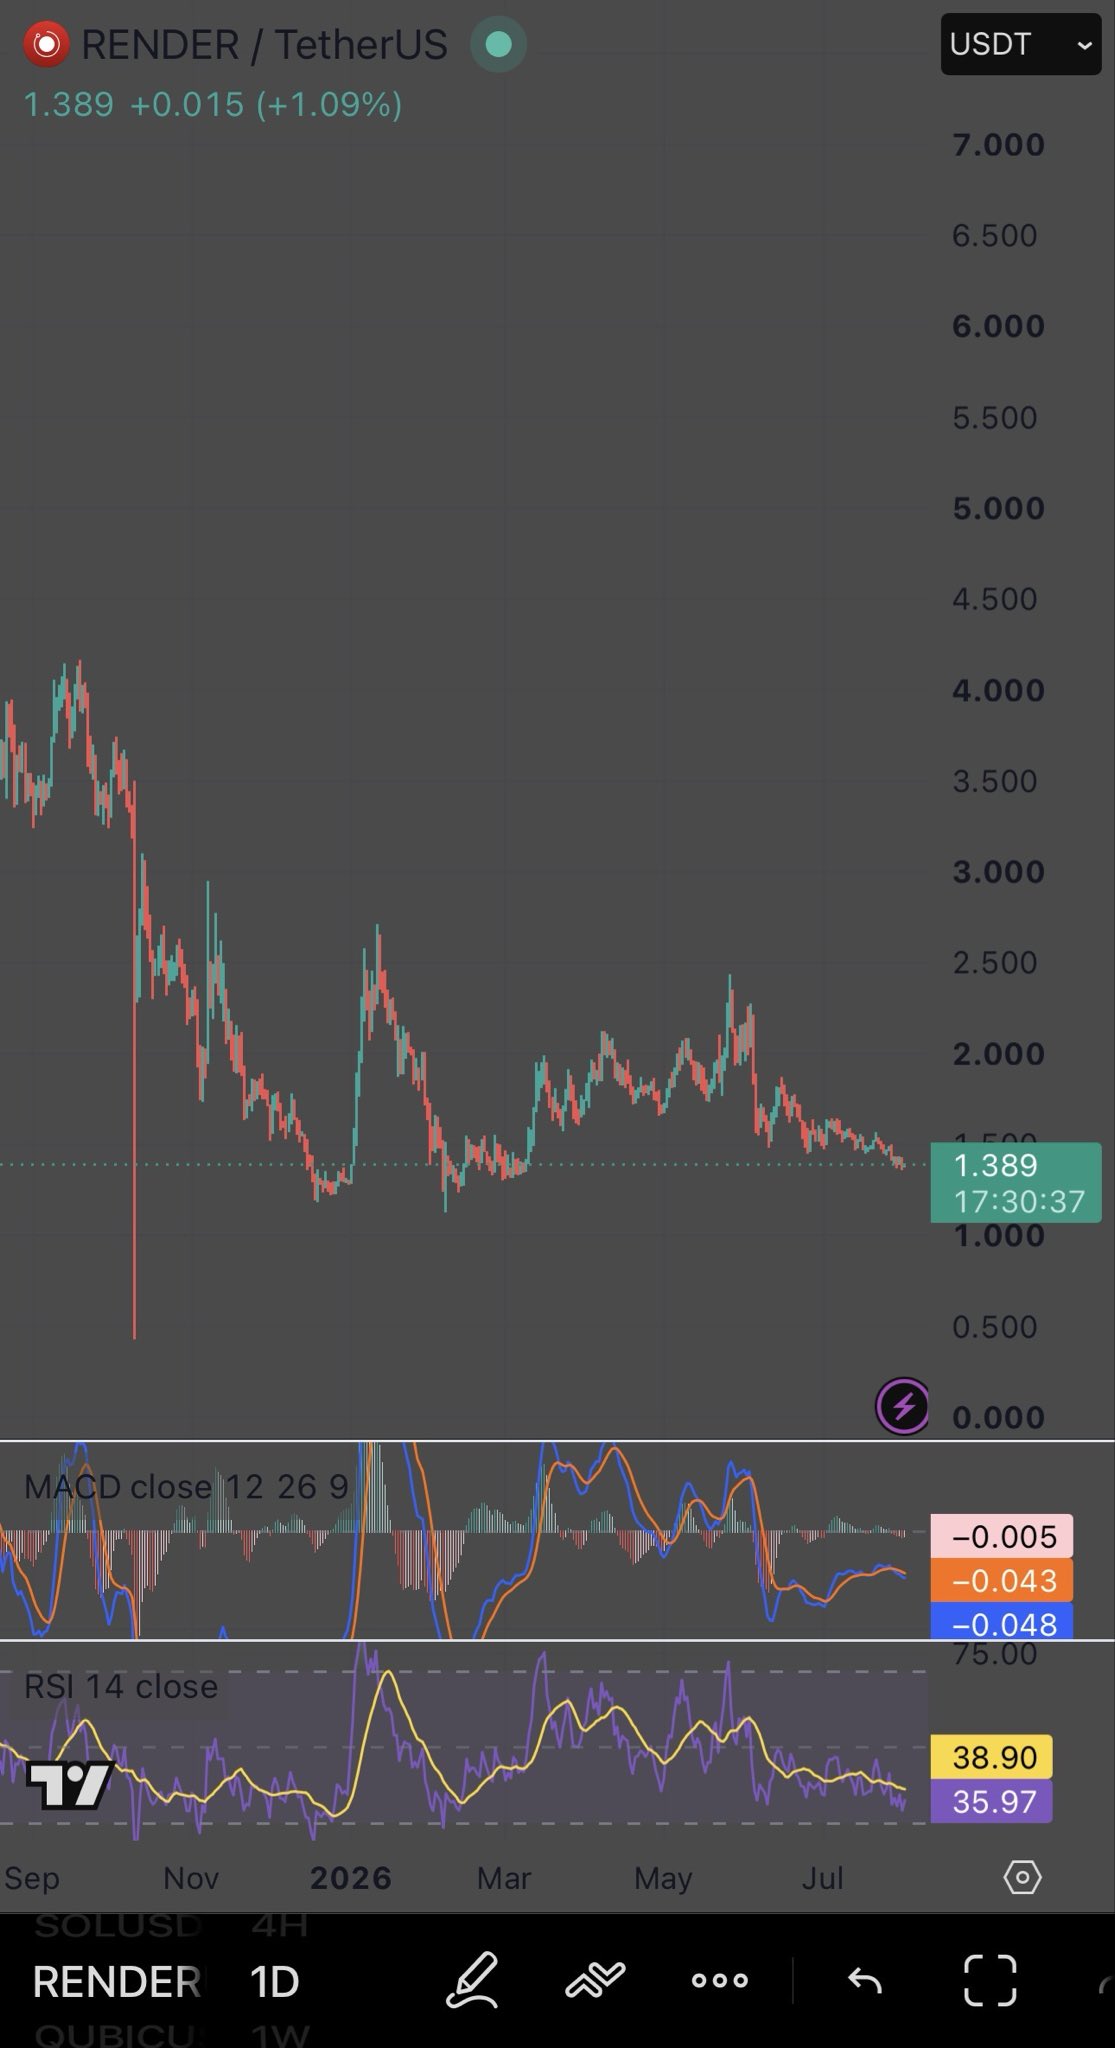
solana:rndrizKT3MK1iimdxRdWabcF7Zg7AR5T4nud4EkHBof fell 67% from its cycle high and the crowd stopped caring.

That is exactly when the chart starts telling the truth.

Price is back at 1.389, sitting on the same floor it defended all through last winter.

One number decides the next move:

1.20

Hold that base and this is a coiled decentralized GPU network with real rendering and AI compute demand behind it.

Lose it and the next honest support sits far below at 1.00.

Momentum is not screaming reversal yet.

RSI near 36 is weak but not oversold, and MACD is trying to curl without confirming.

That is a market catching its breath, not one turning.

Here is the part most people miss.

The best entries never feel safe.

They feel exactly like this, quiet and heavy and boring, while everyone waits for a green candle to hand them permission.

The people who mark 1.20 tonight will not need permission tomorrow.

Save this before it moves.

view 81
view 17
view 4.1K
2026-08-01 06:47
Tendencia de RENDER tras el lanzamiento
Alcista
RNDR在关键支撑位1.20美元附近盘整,作者认为当前是理想入场点,未来有望上涨。
Detalles

Predicción de precios

¿Cuándo es un buen momento para comprar RENDER? ¿Debería comprar o vender RENDER ahora?

Al decidir si es un buen momento para comprar o vender Render (RENDER), es importante ajustarse primero a su propia estrategia de trading y perfil de riesgo. Los inversores a largo plazo y los traders a corto plazo suelen interpretar las condiciones del mercado de forma diferente, por lo que su decisión debe reflejar su enfoque personal. Según el último análisis técnico de 4 horas de RENDER, la señal de trading actual es Hold.
47
Hold
Análisis técnico de 4 horas de RENDER
Última actualización 2026-08-12 11:59:59
beacon

Predicción de Beacon

Pronóstico probabilístico de precios (próximas 24 horas)
i
Descargo de responsabilidad de la predicción de Beacon
Los resultados de los datos que se muestran en esta página se analizan en función de los datos de trading reales (OHLCV) del par de trading seleccionado junto con los indicadores técnicos correspondientes.
Esta predicción es un producto técnico experimental y se proporciona solo con fines de referencia. No constituye un consejo de inversión. Los acontecimientos inesperados del mundo real pueden influir significativamente en el comportamiento del mercado. Por tanto, los traders deben tomar decisiones con precaución.
Sobre Render
Render (RENDER) is a cryptocurrency launched in 2019and operates on the Ethereum platform. Render has a current supply of 533,532,274.56269149 with 518,772,101.28269149 in circulation. The last known price of Render is 1.29691625 USD and is down -2.28 over the last 24 hours. It is currently trading on 656 active market(s) with $13,949,045.61 traded over the last 24 hours. More information can be found at https://rendernetwork.com/.
Leer más
Comprar RENDER
Trade RENDER