Comprar cripto
tarjeta
Comercio P2P
Compra USDT en un marketplace
Tarjeta de crédito/débito
Compre criptomonedas con Visa o MasterCard
Pago vía prestadores
Compre criptomonedas a través de MoonPay, Simplex y más
Tarjeta BitMart
Impulsando su experiencia con las criptomonedas
Tarjeta prepago de criptomonedas
Obtenga una Mastercard lista para usar al instante
Comerciar
USDⓈ-M
Utilizando USDⓈ como colateral
COIN-M
Utilizando la propia moneda como colateral
TradFi
Trading integral para metales, acciones y forex
Operativa de demostración
Aprenda a operar con riesgo cero
Resumen de futuros
Plataforma única para todo lo relacionado con futuros
Rey de Futuros
Pool de premios de 478 000 USDT
Crecer
Resumen de Earn
Activos inactivos, gane con facilidad
Ahorros
Gane intereses conservando su portafolio.
Staking
Staking sencillo, cuantiosas retribuciones.
Gestión de patrimonio
Aumente su riqueza con un equipo de activos top
RWA
Mantenga BMRUSD, disfrute del rendimiento
Exclusivo VIP
Gane de forma estable para usuarios VIP
Rewards
Centro de recompensas
Descubra recompensas exclusivas por valor de hasta 14 000 USDT
LaunchPrime
Una plataforma para lanzar tokens y NFT
Programa de afiliados
Únase para ganar cuantiosas comisiones
Powerdrop
¡La solución AirDrop de próxima generación ya está AQUÍ!
Centro de eventos
El centro unificado para todas las operaciones de trading
Sorteo diario de futuros
100 % de probabilidades de ganar con operaciones diarias
Sorteo diario de Spot
Gane 8888 USDT en grandes premios
Recarga móvil
Recargue móviles de forma fácil, online y segura
Send
Send money globally, fast and secure
BitMart Mall
Viva de las criptomonedas

IREN Ltd (Derivatives) (IREN)
$ 46.39 (IREN/USD)
-3.99%
24H
IREN Ltd (Derivatives) IREN Historial de precios USD
Siga el precio de IREN Ltd (Derivatives) para hoy, 7 días, 30 días y 90 días
Periodo
Cambiar
Cambio (%)
Hoy
$ 1.93
-3.99%
7días
$ 10.73
-18.89%
30días
$ 8.73
-15.92%
90días
$ 8.73
-15.92%
Sea propietario de IREN ahora
Compra y vende IREN fácil y seguro en BitMart.
IREN Ltd (Derivatives) Información de mercado
$ 44.36 Autonomía de 24 horas $ 48.90
Máximo histórico
$ 63.66
El mínimo histórico
$ 43.89
Cambio en 24 h
-3.99%
Volumen en 24 h
$ 0
Suministros en circulación
0.00
IREN
Market Cap
$ 0
Suministro máximo
--
Capitalización de mercado totalmente diluida
$ 0
Trade IREN
Ganar
Pon a trabajar tus criptomonedas inactivas y obtén ingresos pasivos a través de ahorros, staking y más.
IREN Ltd (Derivatives) X Insight

Yimin X
Quant
FA_Analyst
B
 14.5K @yxinsights
 Bajista
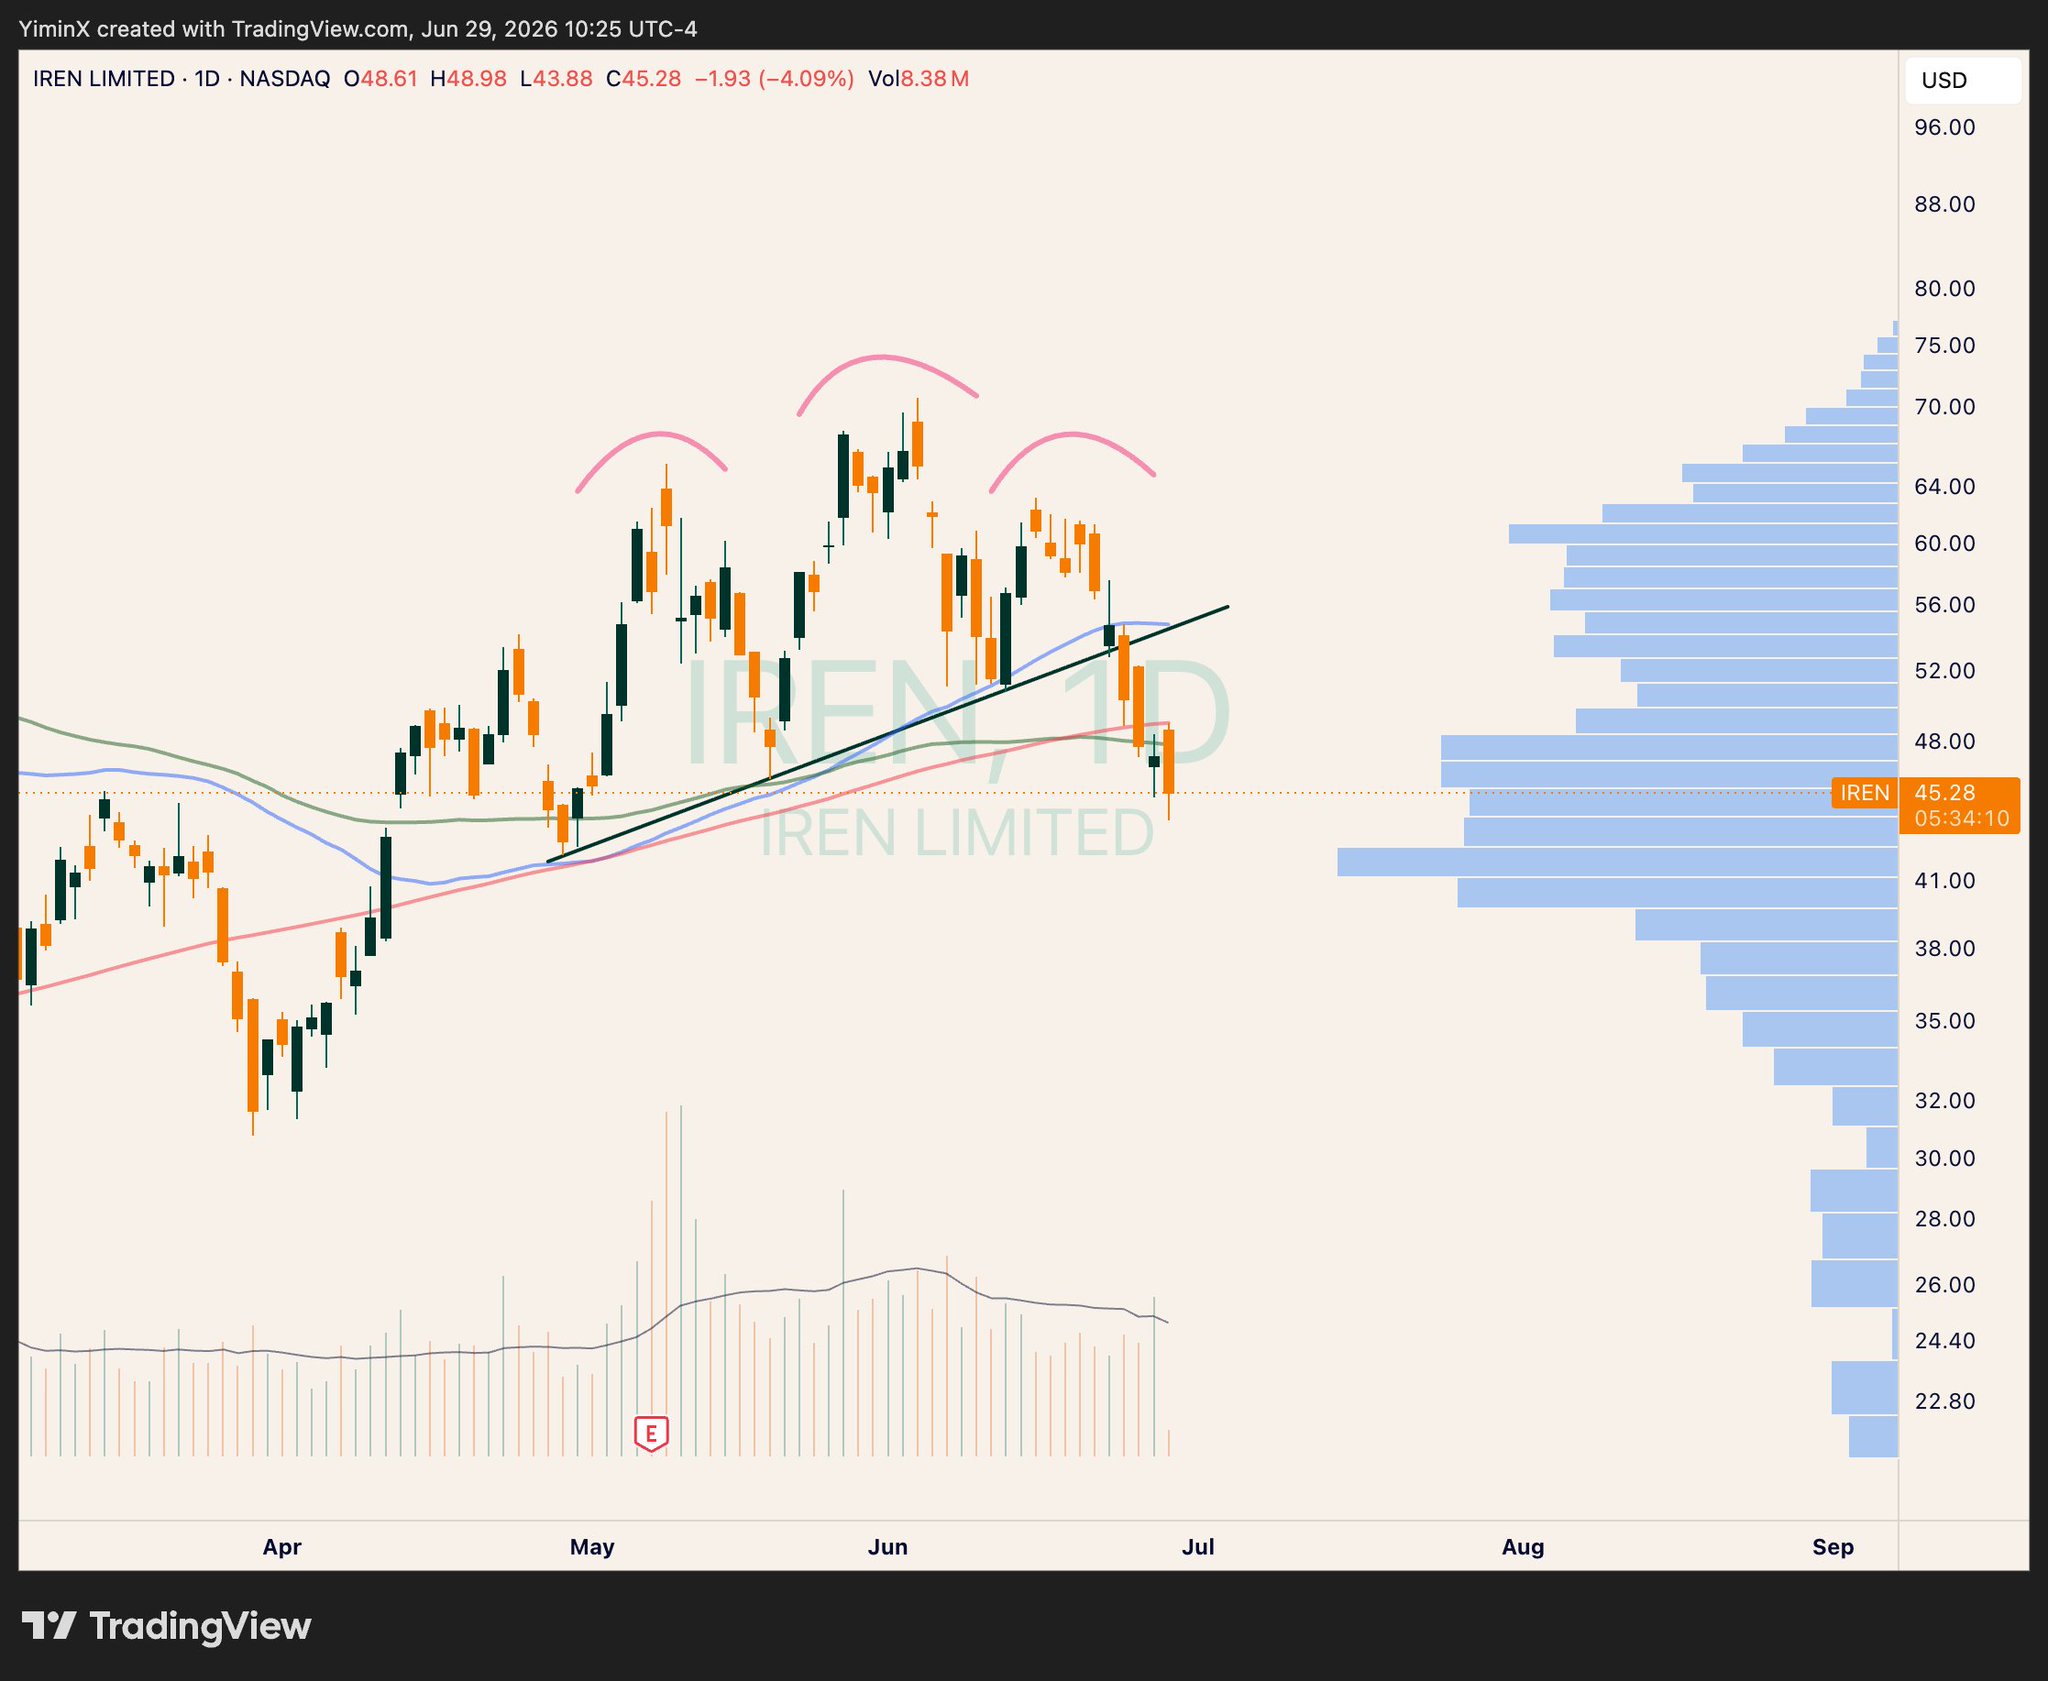
IREN broke below the 200-day moving average, the author stopped out at -18%, and the chart shows a bearish pattern.
Yimin X
Quant
FA_Analyst
B
14.5K @yxinsights Can't say I'm too happy about $IREN.
Lost the 200-day MA and couldn't reclaim it today.
Stopped out after -18% (small position sizing to tolerate the large % loss) https://t.co/tv5S4d44Zg
 16
16
 33
33
 3.9K
3.9K
2026-06-29 18:37
Tendencia de IREN tras el lanzamiento
Extremadamente bajista
IREN broke below the 200-day moving average, the author stopped out at -18%, and the chart shows a bearish pattern.
Yimin X
Quant
FA_Analyst
B
14.5K @yxinsights Bajista
IREN broke below the 200-day moving average, the author stopped out at -18%, and the chart shows a bearish pattern.
Can't say I'm too happy about $IREN.
Lost the 200-day MA and couldn't reclaim it today.
Stopped out after -18% (small position sizing to tolerate the large % loss) https://t.co/tv5S4d44Zg
16
33
3.9K
2026-06-29 15:37
Tendencia de IREN tras el lanzamiento
Extremadamente bajista
IREN broke below the 200-day moving average, the author stopped out at -18%, and the chart shows a bearish pattern.

🔋Chin🔋
TA_Analyst
Trader
C
4.0K @PhatChin Extremadamente bajista
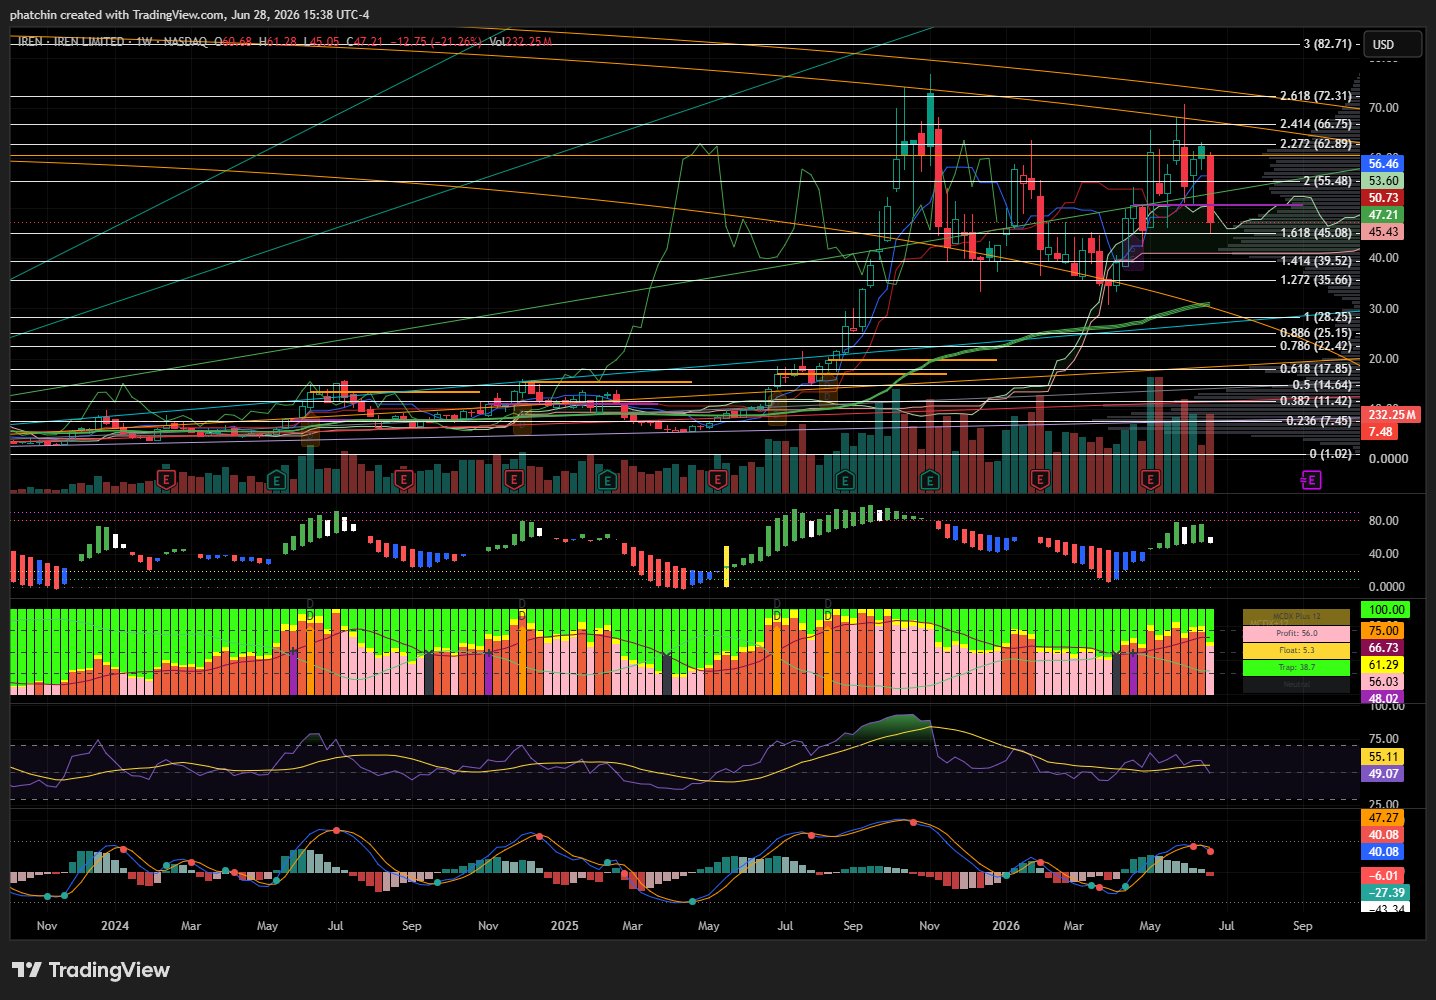
IREN retested the Fibonacci 1.618, but indicators are trending downward, MCDX is weak, short-term outlook is not optimistic.
$IREN W 🟥
Price action dutifully back-tested the 1.618 Fib and closed inside the Ichimoku cloud suggests it is ready to explore this Fib level further. Indicators curling down with MCDX going dormant pink is not a good sign. We need the 1.618 to support. https://t.co/s63krXuhC4
 7
0
564
7
0
564
2026-06-28 19:57
Tendencia de IREN tras el lanzamiento
Bajista
IREN retested the Fibonacci 1.618, but indicators are trending downward, MCDX is weak, short-term outlook is not optimistic.
Predicción de precios
¿Cuándo es un buen momento para comprar IREN? ¿Debería comprar o vender IREN ahora?
Al decidir si es un buen momento para comprar o vender IREN Ltd (Derivatives) (IREN), es importante ajustarse primero a su propia estrategia de trading y perfil de riesgo. Los inversores a largo plazo y los traders a corto plazo suelen interpretar las condiciones del mercado de forma diferente, por lo que su decisión debe reflejar su enfoque personal. Según el último análisis técnico de 4 horas de IREN, la señal de trading actual es Hold.

Predicción de Beacon
Pronóstico probabilístico de precios (próximas 24 horas)Descargo de responsabilidad de la predicción de Beacon
Los resultados de los datos que se muestran en esta página se analizan en función de los datos de trading reales (OHLCV) del par de trading seleccionado junto con los indicadores técnicos correspondientes.
Esta predicción es un producto técnico experimental y se proporciona solo con fines de referencia. No constituye un consejo de inversión. Los acontecimientos inesperados del mundo real pueden influir significativamente en el comportamiento del mercado. Por tanto, los traders deben tomar decisiones con precaución.
Esta predicción es un producto técnico experimental y se proporciona solo con fines de referencia. No constituye un consejo de inversión. Los acontecimientos inesperados del mundo real pueden influir significativamente en el comportamiento del mercado. Por tanto, los traders deben tomar decisiones con precaución.
Sobre IREN Ltd (Derivatives)
IREN Ltd (Derivatives) (IREN) is a cryptocurrency . IREN Ltd (Derivatives) has a current supply of 0. The last known price of IREN Ltd (Derivatives) is 47.47211414 USD and is down -0.80 over the last 24 hours. It is currently trading on 30 active market(s) with $0.00 traded over the last 24 hours.
Leer más
Explorar más
BM Discovery


Nuevo listado

APLDON Applied Digital
-- 0.00%

NEEON NextEra Energy
-- 0.00%

ONON ON Semiconductor Corporation
-- 0.00%

SCHWON The Charles Schwab Corporation
-- 0.00%

ANSEM The Black Bull
-- 0.00%

CIFRON Cipher Mining Inc.
-- 0.00%

WULFON TeraWulf Inc.
-- 0.00%

PINSON Pinterest, Inc.
-- 0.00%

HPEON Hewlett Packard Enterprise Co
-- 0.00%

PCGON PG&E
-- 0.00%