Rewards
Futures Daily Draw
100% Chance To Win With Daily Trades
Spot Daily Draw
Win 8,888 USDT In Grand Prizes
Mobile Top-Up
Top up mobiles easily, online, secure
Send
Send money globally, fast and secure
BitMart Mall
Live on crypto

IREN Ltd (Derivatives) (IREN)
$ 46.39 (IREN/USD)
-3.99%
24H
IREN Ltd (Derivatives) IREN Price History USD
Track the price of IREN Ltd (Derivatives) for today, 7 days, 30 days and 90 days
Period
Change
Change (%)
Today
$ 1.93
-3.99%
7days
$ 10.73
-18.89%
30days
$ 8.73
-15.92%
90days
$ 8.73
-15.92%
Own IREN Now
Buy and sell IREN easily and securely on BitMart.
IREN Ltd (Derivatives) Market Information
$ 44.36 24h Range $ 48.90
All time high
$ 63.66
All time low
$ 43.89
24h Change
-3.99%
24h Vol
$ 0
Circulating supply
0.00
IREN
Market cap
$ 0
Max supply
--
Fully diluted market cap
$ 0
Trade IREN

IREN Ltd (Derivatives) X Insight

Yimin X
Quant
FA_Analyst
B
 14.5K @yxinsights
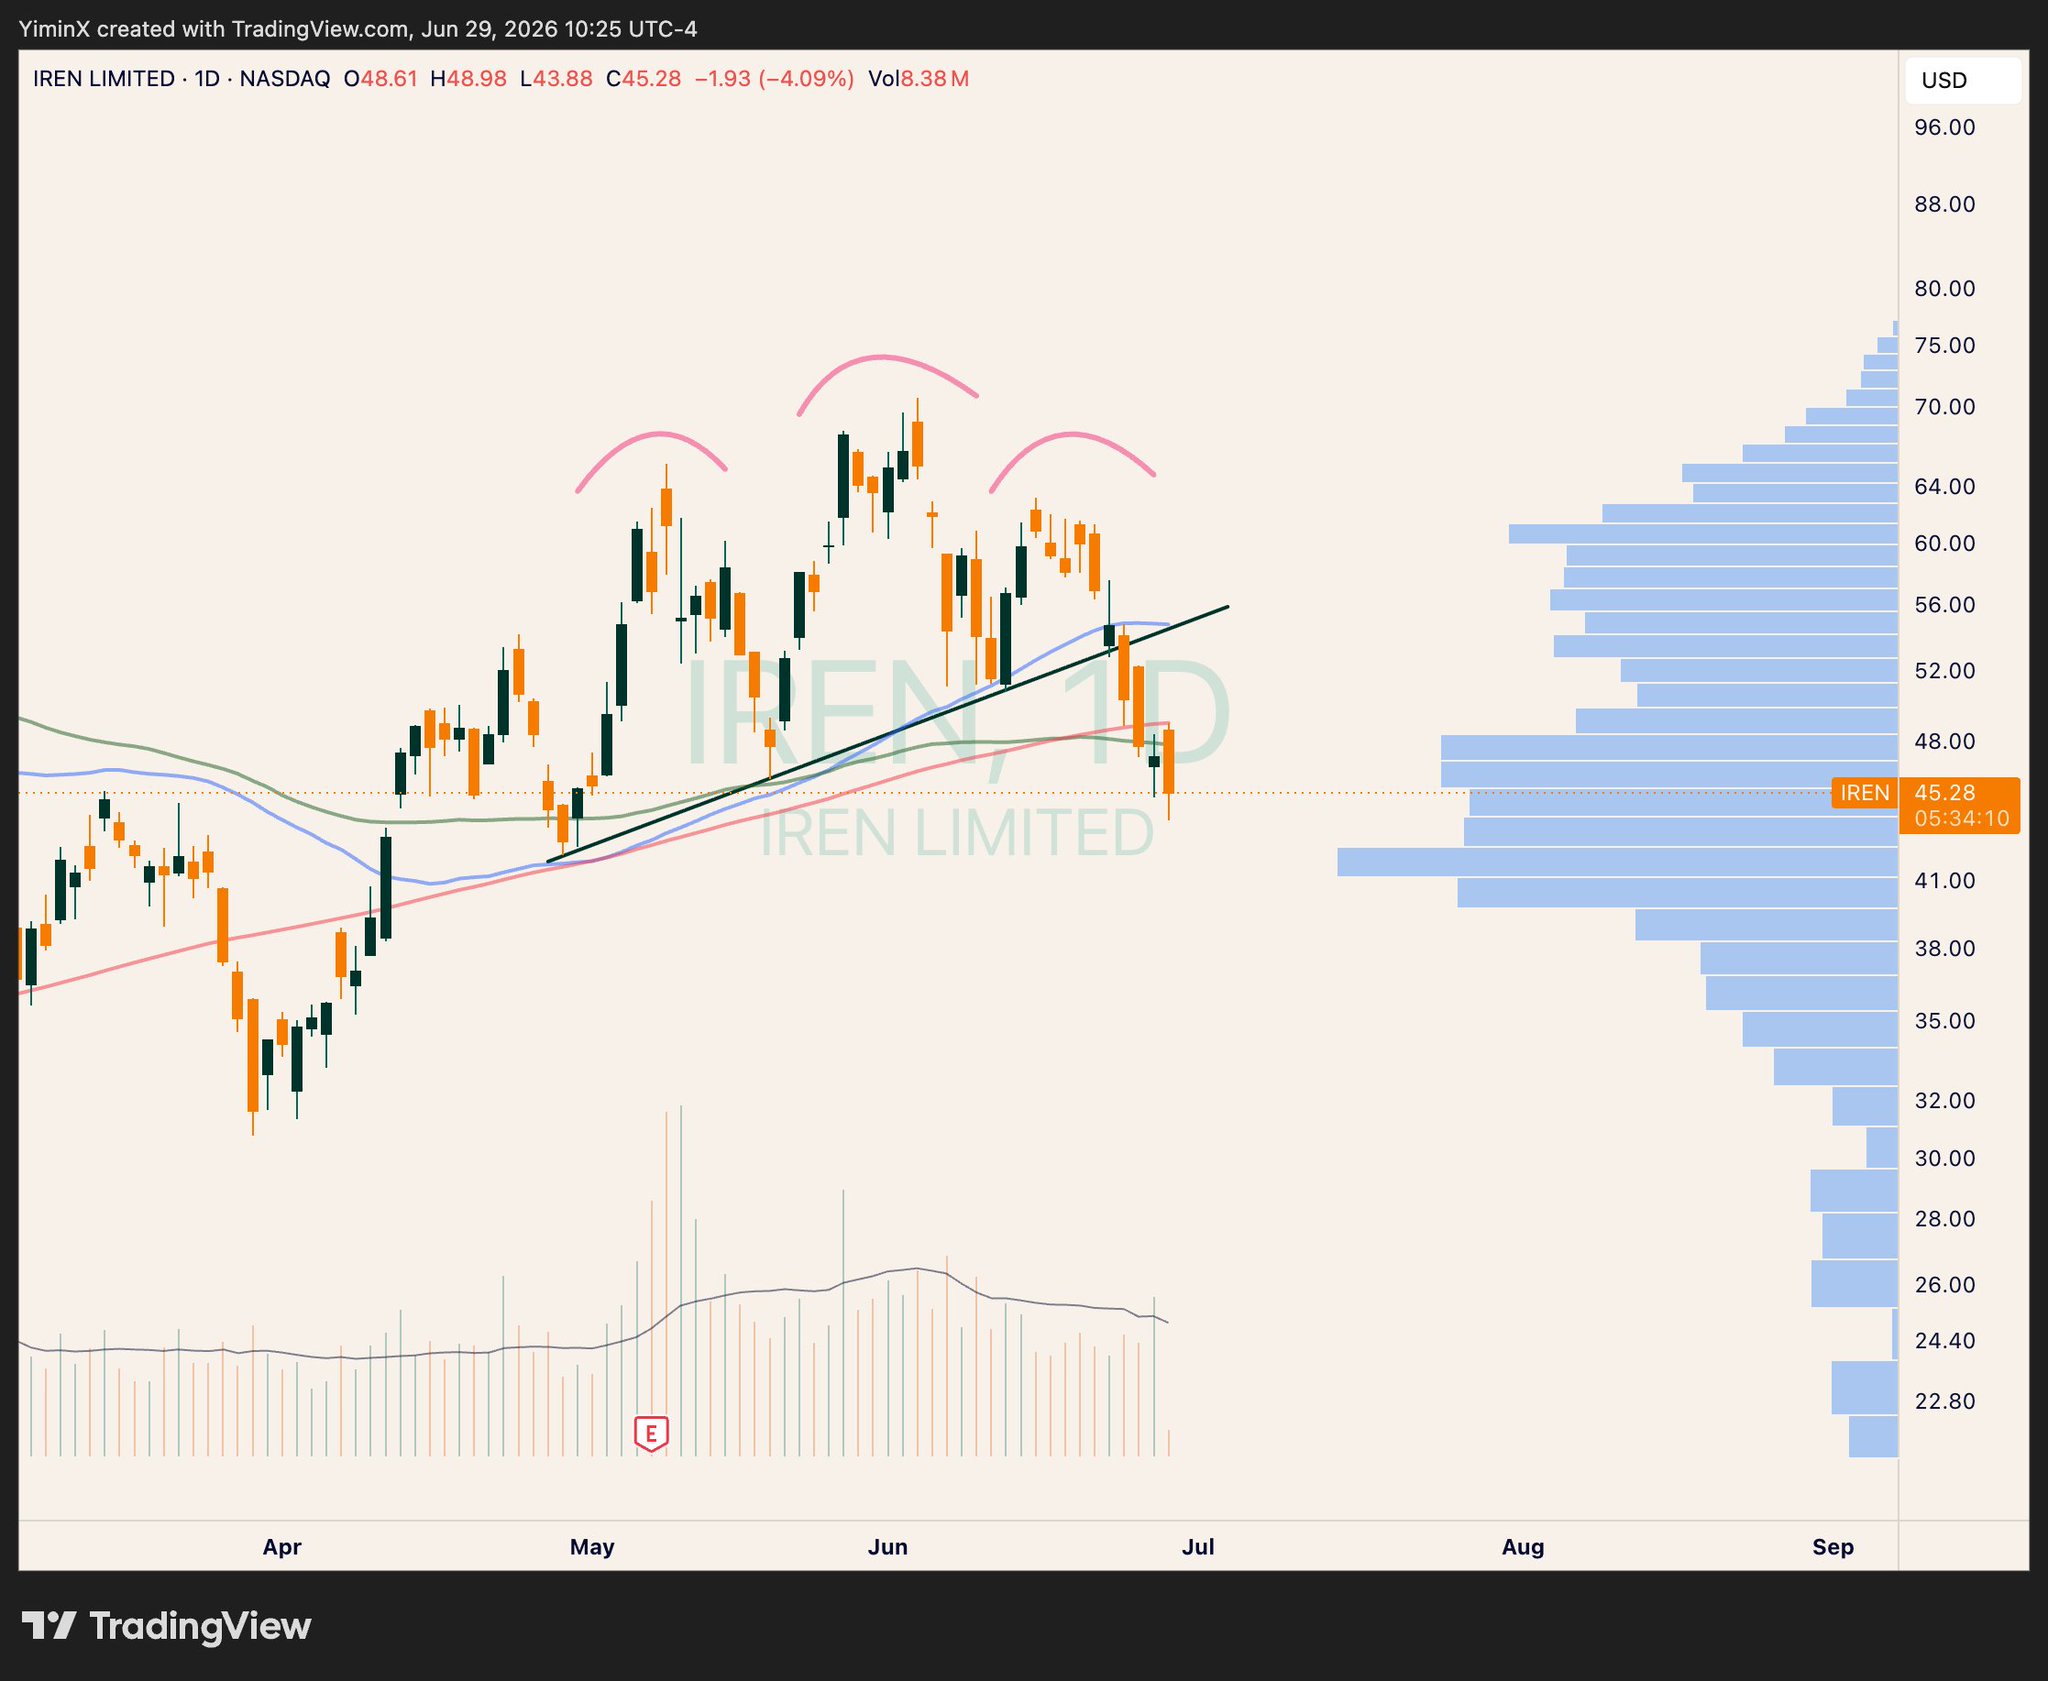
 Bearish
IREN broke below the 200-day moving average, the author stopped out at -18%, and the chart shows a bearish pattern.
Yimin X
Quant
FA_Analyst
B
14.5K @yxinsights Can't say I'm too happy about $IREN.
Lost the 200-day MA and couldn't reclaim it today.
Stopped out after -18% (small position sizing to tolerate the large % loss) https://t.co/tv5S4d44Zg
 16
16
 33
33
 3.9K
3.9K
2026-06-29 18:37
Trend of IREN after release
Extremely Bearish
IREN broke below the 200-day moving average, the author stopped out at -18%, and the chart shows a bearish pattern.
Yimin X
Quant
FA_Analyst
B
14.5K @yxinsights Bearish
IREN broke below the 200-day moving average, the author stopped out at -18%, and the chart shows a bearish pattern.
Can't say I'm too happy about $IREN.
Lost the 200-day MA and couldn't reclaim it today.
Stopped out after -18% (small position sizing to tolerate the large % loss) https://t.co/tv5S4d44Zg
16
33
3.9K
2026-06-29 15:37
Trend of IREN after release
Extremely Bearish
IREN broke below the 200-day moving average, the author stopped out at -18%, and the chart shows a bearish pattern.

🔋Chin🔋
TA_Analyst
Trader
C
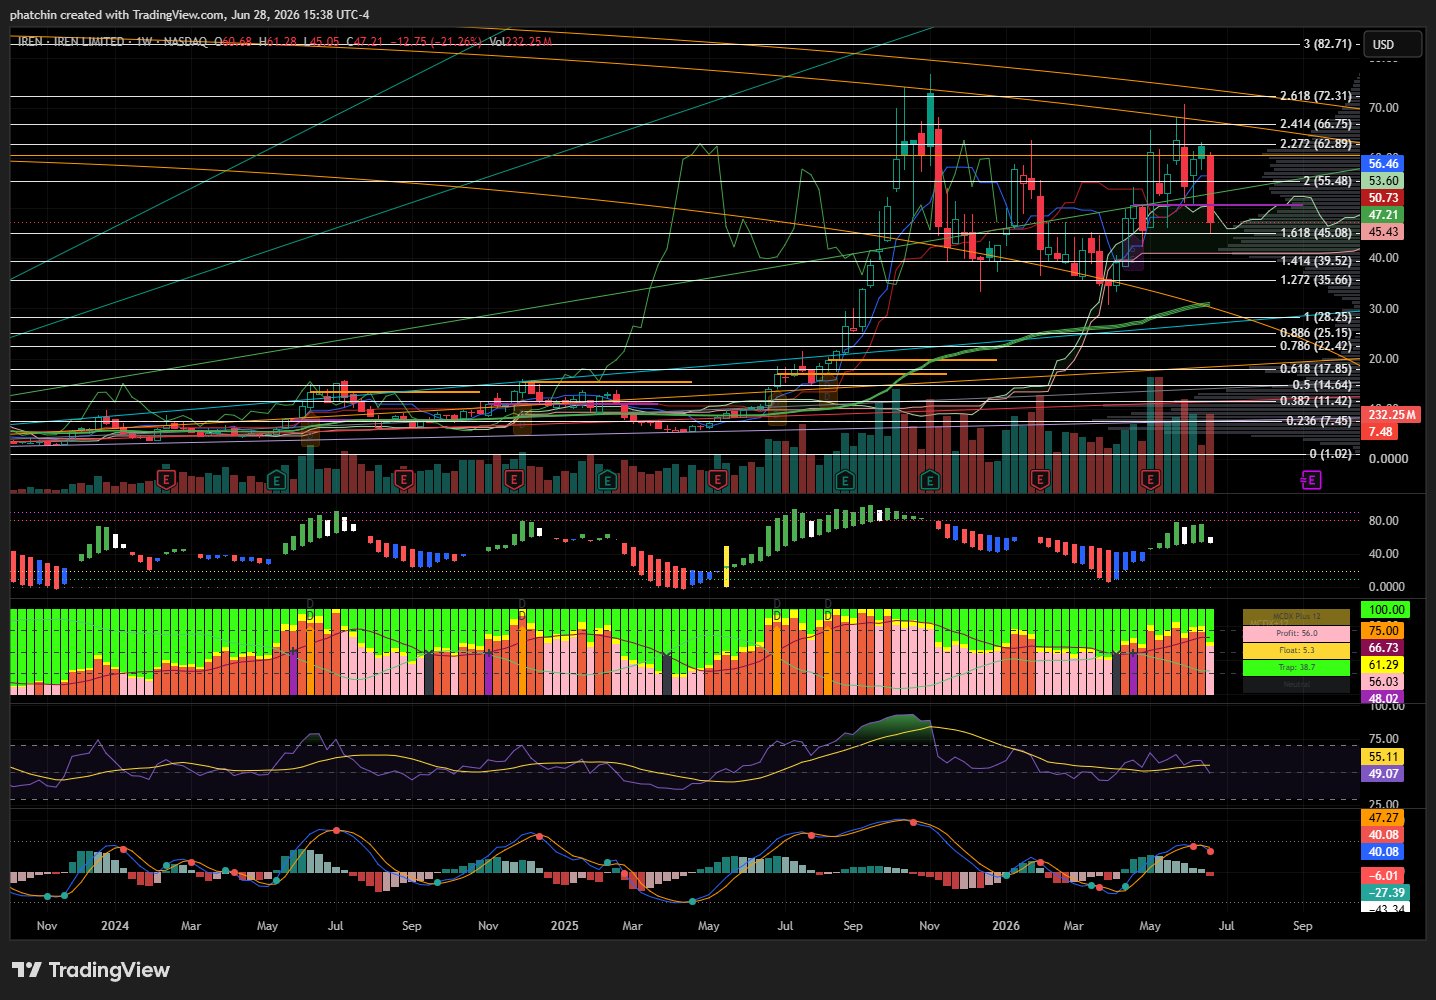
4.0K @PhatChin Extremely Bearish
IREN retested the Fibonacci 1.618, but indicators are trending downward, MCDX is weak, short-term outlook is not optimistic.
$IREN W 🟥
Price action dutifully back-tested the 1.618 Fib and closed inside the Ichimoku cloud suggests it is ready to explore this Fib level further. Indicators curling down with MCDX going dormant pink is not a good sign. We need the 1.618 to support. https://t.co/s63krXuhC4
 7
0
564
7
0
564
2026-06-28 19:57
Trend of IREN after release
Bearish
IREN retested the Fibonacci 1.618, but indicators are trending downward, MCDX is weak, short-term outlook is not optimistic.
Price Prediction
When is a good time to buy IREN? Should I buy or sell IREN now?
When deciding whether it’s a good time to buy or sell IREN Ltd (Derivatives) (IREN), it’s important to first align with your own trading strategy and risk profile.Long-term investors and short-term traders often interpret market conditions differently, so your decision should reflect your personal approach. According to the latest IREN 4-hour technical analysis, the current trading signal is Hold.

Beacon Prediction
Probabilistic Price Forecast (Next 24 Hours)Beacon Prediction Disclaimer
The data results displayed on this page are analyzed based on actual trading data (OHLCV) of the selected trading pair along with corresponding technical indicators.
This prediction is an experimental technical product and is provided for reference purposes only. It does not constitute investment advice. Unexpected real-world events may significantly impact market behavior. Traders should make decisions with caution.
This prediction is an experimental technical product and is provided for reference purposes only. It does not constitute investment advice. Unexpected real-world events may significantly impact market behavior. Traders should make decisions with caution.
About IREN Ltd (Derivatives)
IREN Ltd (Derivatives) (IREN) is a cryptocurrency . IREN Ltd (Derivatives) has a current supply of 0. The last known price of IREN Ltd (Derivatives) is 47.47211414 USD and is down -0.80 over the last 24 hours. It is currently trading on 30 active market(s) with $0.00 traded over the last 24 hours.
Read More
Explore More
BM Discovery


New Listing

APLDON Applied Digital
-- 0.00%

NEEON NextEra Energy
-- 0.00%

ONON ON Semiconductor Corporation
-- 0.00%

SCHWON The Charles Schwab Corporation
-- 0.00%

ANSEM The Black Bull
-- 0.00%

CIFRON Cipher Mining Inc.
-- 0.00%

WULFON TeraWulf Inc.
-- 0.00%

PINSON Pinterest, Inc.
-- 0.00%

HPEON Hewlett Packard Enterprise Co
-- 0.00%

PCGON PG&E
-- 0.00%