
📺 Ubisoft shuts Champions Tactics Oct 30 as WEMIX loses $724K to exploit
Learn more about:
Full breakdown 👇
➡️ Watch Video: https://t.co/85N6fwxxcI
Krypto kaufen
Karte
P2P-Handel
USDT über Marketplace kaufen
Kredit-/Debitkarte
Kaufen Sie Kryptowährungen mit Visa oder Mastercard
Zahlung durch Dritte
Kaufen Sie Krypto über MoonPay, Simplex und mehr.
BitMart-Karte
Stärken Sie Ihr Krypto-Leben
Krypto-Prepaid-Karte
Erhalten Sie sofort eine Mastercard, die Sie verwenden können
Handeln
USDⓈ-M
Verwendung von USDⓈ als Sicherheit
COIN-M
Coin selbst als Sicherheit einsetzen
TradFi
Handel mit Metallen, Aktien und Devisen aus einer Hand
Demo-Handel
Erfahren Sie, wie Sie ohne Risiko handeln können
Futures-Übersicht
Die zentrale Plattform für alles rund um Futures
Futures King
Preispool in Höhe von 478.000 USDT
Wachsen
Earn-Übersicht
Mit ungenutzten Assets mühelos verdienen
Ersparnisse
Zinsen mit Beständen verdienen
Staking
Einfaches Staking, hohe Prämien.
Vermögensverwaltung
ermehren Sie Ihr Vermögen mit einem erstklassigen Asset-Team
RWA
Halten Sie BMRUSD, nutzen Sie den Ertrag
Exklusiv für VIP
Stabiles Verdienen für VIP-Benutzer
Rewards
Prämienzentrale
Entdecken Sie exklusive Belohnungen im Wert von bis zu 14.000 USDT
LaunchPrime
Eine Plattform zur Einführung von Token und NFT
Partnerprogramm
Melden Sie sich an, um hohe Provisionen zu verdienen
Powerdrop
Die Airdrop-Lösung der nächsten Generation ist LIVE!
Veranstaltungszentrale
Der zentrale Hub für alle Geschäftsabläufe
Futures Tagesverlosung
100% Gewinnchance bei täglichen Trades
Spot-Tagesziehung
Gewinnen Sie 8.888 USDT an Hauptpreisen insgesamt
Staking zur Stimmabgabe
Verdienen Sie Airdrops durch Abstimmung
Institution
Professionelle und exklusive Services
VIP
Exklusive Rewards freischalten
Academy
Machen Sie sich schnell mit dem Handel und der Blockchain vertraut
BitMart-Praktikum
Beginnen Sie hier Ihre Krypto-Karriere
BitMart Travel
Weltweite Reisedienstleistungen aus einer Hand
Mobiles Aufladen
Laden Sie Mobiltelefone einfach, online und sicher auf.
Send
Send money globally, fast and secure
BitMart Mall
Leben mit Krypto
WEMIX Live Kursdaten
Der heutige Preis von WEMIX ist $ 0.19 (WEMIX/USD). Mit einer Marktkapitalisierung von $ 99.85M USD. 24-Stunden-Handelsvolumen von $ 486.32K USD, Eine 24-Stunden-Preisänderung von +0.00%, Sowie einer Umlaufmenge von 499.36M WEMIX.
WEMIX WEMIX Preisverlauf USD
Verfolgen Sie den Preis von WEMIX für heute, 7 Tage, 30 Tage und 90 Tage
Zeitraum
Ändern
Veränderung (%)
Heute
$ 0
0.00%
7Tage
--
--
30Tage
--
--
90Tage
--
--
Besitzen Sie WEMIX jetzt
Kaufen und verkaufen Sie WEMIX einfach und sicher auf BitMart.
WEMIX Marktinformationen
$ 0.19 24-Std.-Bereich $ 0.19
Allzeithoch
$ 0
Allzeittief
$ 0
24-Std.-Veränderung
0.00%
Menge 24 Std.
$ 486,316.30
Zirkulierendes Angebot
499.36M
WEMIX
Marktobergrenze
$ 99.85M
Nettomenge
0.59B
WEMIX
Vollständig verwässerte Marktobergrenze
$ 117.98M
Handel WEMIX
Verdienen
Setzen Sie Ihre ungenutzten Kryptowährungen ein und erzielen Sie passives Einkommen durch Ersparnisse, Staking und mehr.
WEMIX X Insight

PlayToEarn
OnChain_Analyst
Media
B
 83.6K @PlayToEarn
 Extrem bärisch
WEMIX因漏洞损失724K美元,短期看空
 24
24
 7
7
 8.6K
8.6K
2026-07-31 12:57
Trend von WEMIX nach Veröffentlichung
Bärisch
WEMIX因漏洞损失724K美元,短期看空

Kurnia Bijaksana
TA_Analyst
Educator
C
47.3K @mkbijaksana Extrem bullisch
The tweet shares an altcoin trading strategy that identifies and follows rising trends when BTC dominance is falling and altcoins are bullish.
Pro tip: If the market is in a condition where
- BTC dominance is falling
- TOTAL2 shows a bullish signal
- Large altcoins are above the 21 EMA on the 1-day timeframe
Check the method below
Kurnia Bijaksana
TA_Analyst
Educator
C
47.3K @mkbijaksana DAILY CRYPTO TRADING TUTORIAL: FOLLOW THE TREND (BULLISH)
This method utilizes the follow‑the‑trend principle.
My principle: What goes up will keep going up until a reversal sign appears.
Therefore, we take advantage of assets that are gaining momentum and try to follow their upward move.
Step 1: Market Screening.
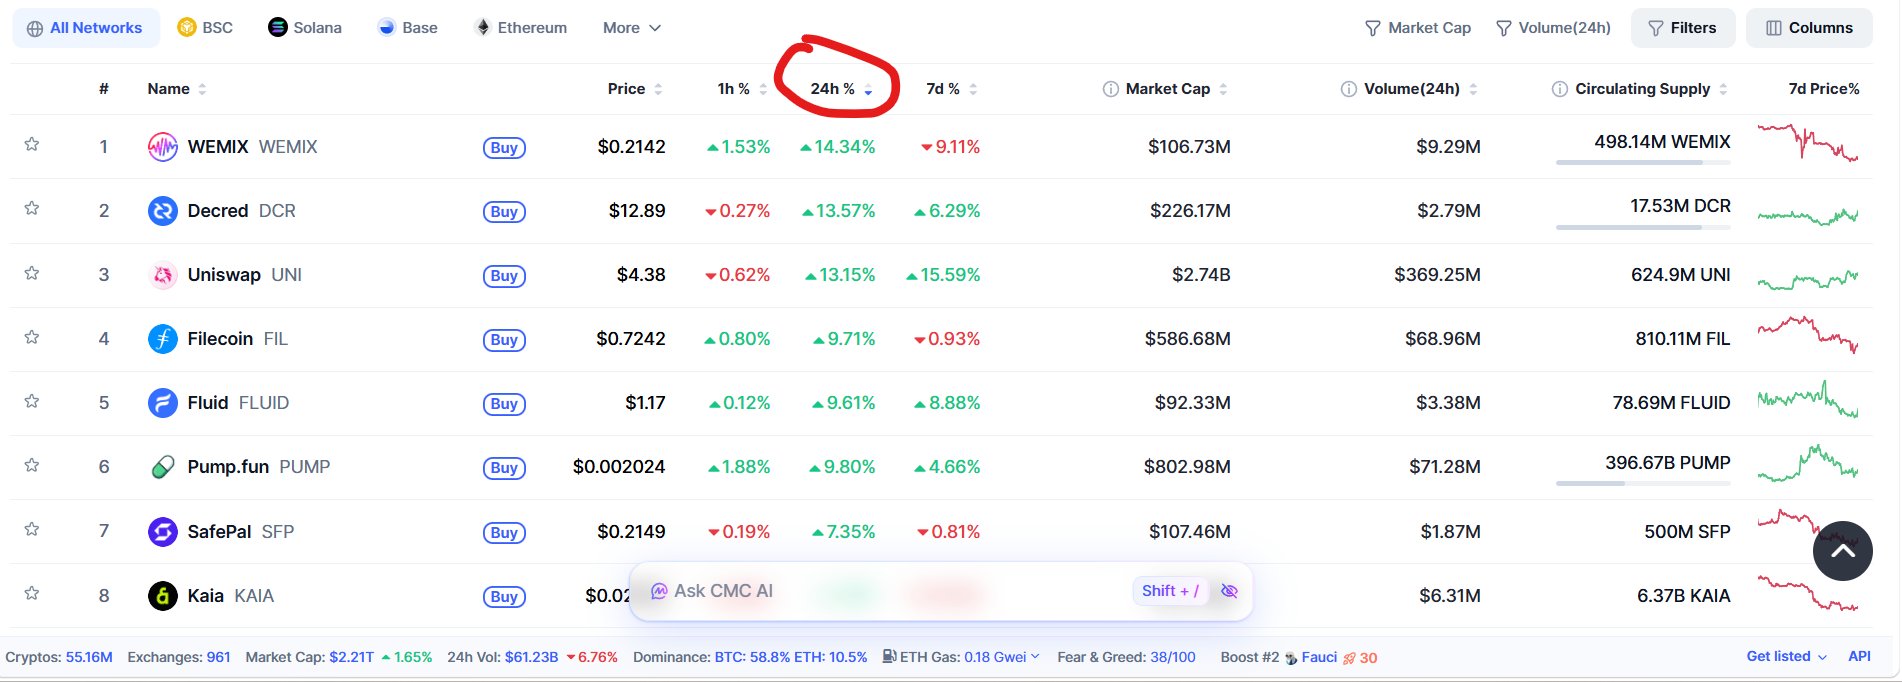
Go to CoinMarketCap, or your favorite exchange. Sort by 24H% or top gainers. You can click the 24H% or %Gains column depending on the exchange, until it lists the highest (see image 1). The example image shows WEMIX, DCR, UNI, among others.
Step 2: Ensure a bullish bias.
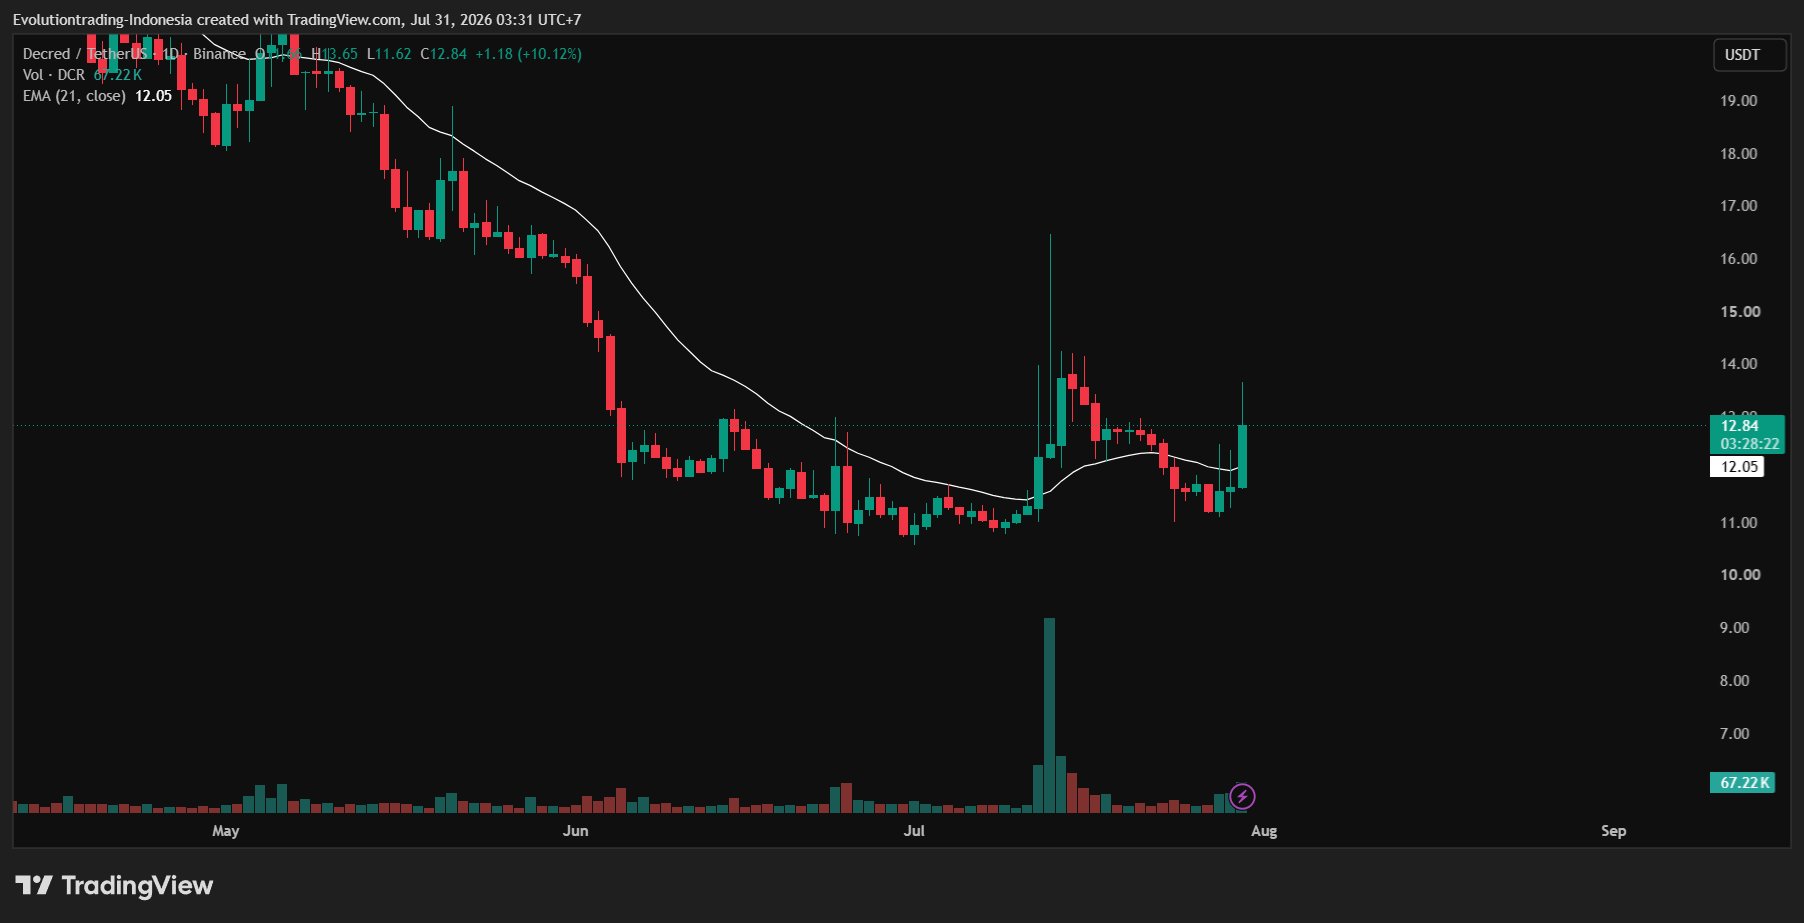
Open TradingView (or the exchange you use, on its chart). Switch to the 1‑day timeframe first. Make sure:
- The chart is bullish (green) and
- Not too high. Avoid charts that look like tall pillars on the 1‑day timeframe; they are usually too late.
(See example in image 2)
You can look at several charts, mark those meeting the criteria, then proceed to step 3.
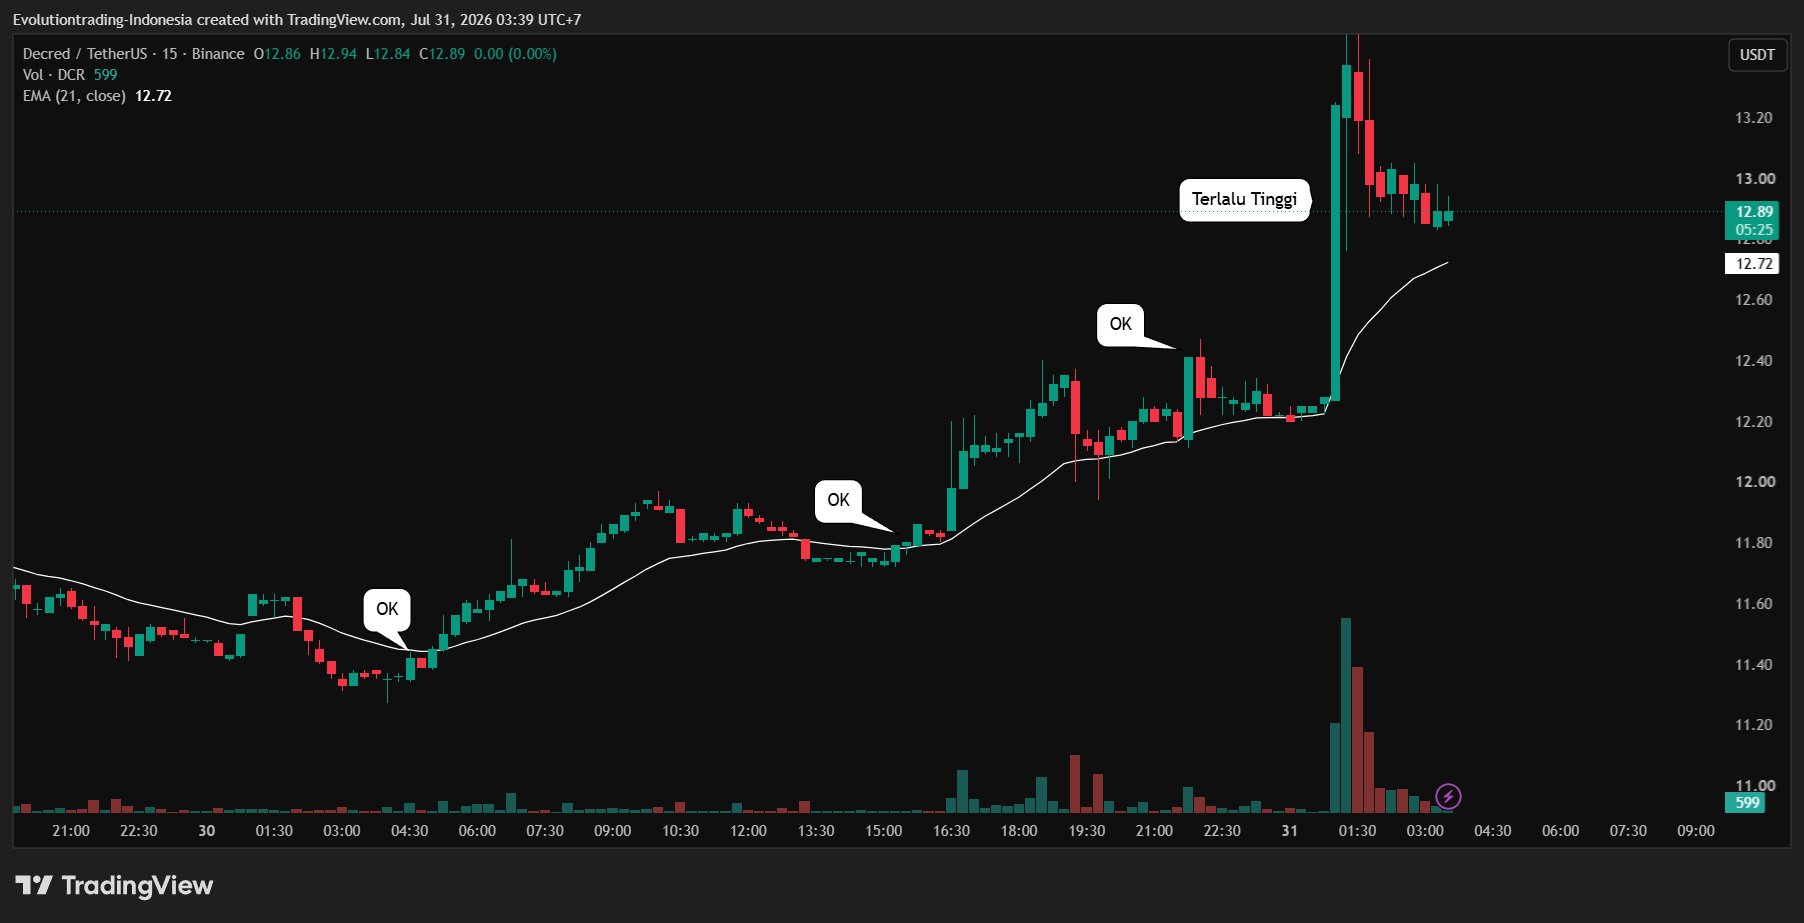
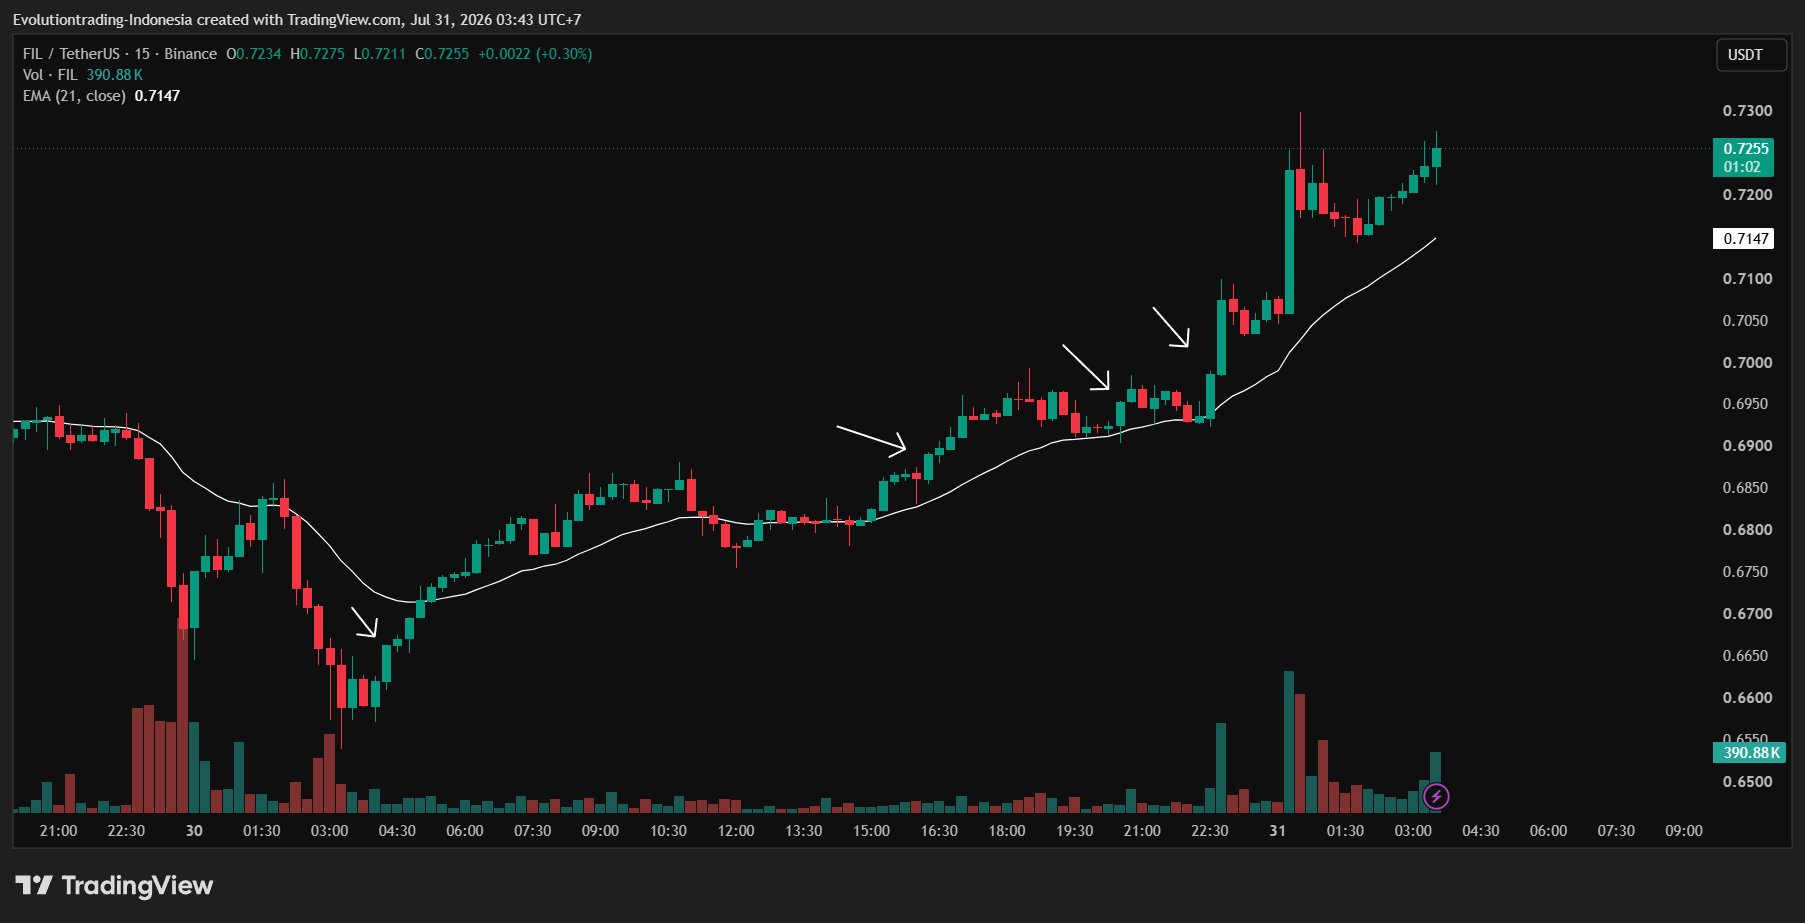
Step 3: Entry Trigger
There are many ways, I will discuss them later.
 21
0
2.3K
21
0
2.3K
2026-07-31 04:57
Trend von WEMIX nach Veröffentlichung
Extrem bullisch
The tweet shares an altcoin trading strategy that identifies and follows rising trends when BTC dominance is falling and altcoins are bullish.
Kurnia Bijaksana
TA_Analyst
Educator
C
47.3K @mkbijaksana Bullisch
The tweet shares an altcoin trading strategy that identifies and follows rising trends when BTC dominance is falling and altcoins are bullish.
DAILY CRYPTO TRADING TUTORIAL: FOLLOW THE TREND (BULLISH)
This method utilizes the follow‑the‑trend principle.
My principle: What goes up will keep going up until a reversal sign appears.
Therefore, we take advantage of assets that are gaining momentum and try to follow their upward move.
Step 1: Market Screening.
Go to CoinMarketCap, or your favorite exchange. Sort by 24H% or top gainers. You can click the 24H% or %Gains column depending on the exchange, until it lists the highest (see image 1). The example image shows WEMIX, DCR, UNI, among others.
Step 2: Ensure a bullish bias.
Open TradingView (or the exchange you use, on its chart). Switch to the 1‑day timeframe first. Make sure:
- The chart is bullish (green) and
- Not too high. Avoid charts that look like tall pillars on the 1‑day timeframe; they are usually too late.
(See example in image 2)
You can look at several charts, mark those meeting the criteria, then proceed to step 3.
Step 3: Entry Trigger
There are many ways, I will discuss them later.
190
6
32.6K
2026-07-31 03:17
Trend von WEMIX nach Veröffentlichung
Bullisch
The tweet shares an altcoin trading strategy that identifies and follows rising trends when BTC dominance is falling and altcoins are bullish.
Preisprognose
Wann ist ein guter Zeitpunkt, um WEMIX zu kaufen? Soll ich WEMIX jetzt kaufen oder verkaufen?
Bei der Entscheidung, ob es ein guter Zeitpunkt ist, WEMIX (WEMIX) zu kaufen oder zu verkaufen, ist es wichtig, sich zunächst an der eigenen Handelsstrategie und Ihrem Risikoprofil zu orientieren. Langfristig orientierte Anleger und kurzfristig orientierte Trader interpretieren Marktbedingungen oft unterschiedlich, daher sollte Ihre Entscheidung Ihre persönliche Herangehensweise widerspiegeln. Laut der neuesten vierstündigen technischen Analyse von WEMIX lautet das aktuelle Handelssignal Halten.

Beacon Vorhersage
Probabilistische Preisprognose (nächste 24 Stunden)Haftungsausschluss für Beacon-Vorhersagen
Die auf dieser Seite angezeigten Datenergebnisse werden basierend auf tatsächlichen Handelsdaten (OHLCV) des ausgewählten Handelspaares und den entsprechenden technischen Indikatoren analysiert.
Diese Prognose ist ein experimentelles technisches Produkt und wird lediglich zu Informationszwecken angegeben. Dies stellt keine Anlageberatung dar. Unerwartete Ereignisse in der realen Welt können erhebliche Auswirkungen auf das Marktverhalten haben. Händler sollten Entscheidungen mit Vorsicht treffen.
Diese Prognose ist ein experimentelles technisches Produkt und wird lediglich zu Informationszwecken angegeben. Dies stellt keine Anlageberatung dar. Unerwartete Ereignisse in der realen Welt können erhebliche Auswirkungen auf das Marktverhalten haben. Händler sollten Entscheidungen mit Vorsicht treffen.
Über WEMIX
WEMIX (WEMIX) is a cryptocurrency launched in 2020. WEMIX has a current supply of 560,158,782.4927065 with 499,361,870.28307045 in circulation. The last known price of WEMIX is 0.19399076 USD and is up 1.22 over the last 24 hours. It is currently trading on 65 active market(s) with $346,636.25 traded over the last 24 hours. More information can be found at http://wemix.com/.
Mehr lesen
Kaufen WEMIX
Handel WEMIX